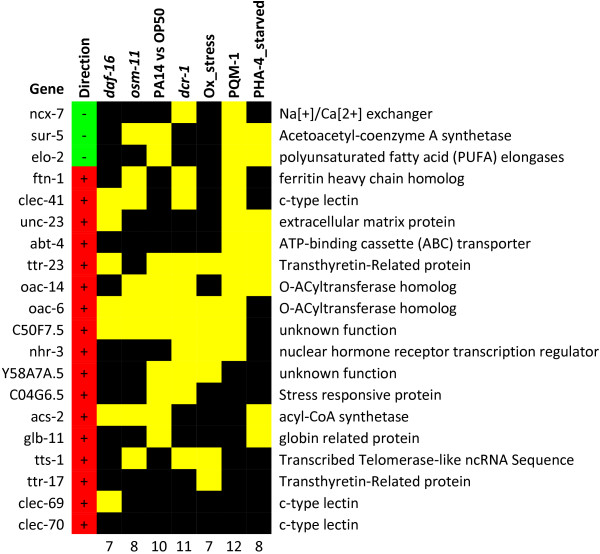
Figure 8.
Enrichment analyses of the 20 genes found to be differentially expressed after 2 h of exposure to dichlorvos were performed (Additional files2,3,4). Columns include experiments where enrichment was observed for at least one condition. Lists from microarray clusters for up and down-regulated genes were merged for daf-16[25], osm-11[55], and dcr-1 [56], Ox_stress [57] and also for time after infection for PA14 vs OP50 [39]. PQM-1 and PHA-4_starved are list of genes with binding sites for the respective transcription factors [24]. Cells marked with yellow indicate dichlorvos-responsive genes that are present in the gene set indicated at the head of the table. The numbers at the foot indicate the number of genes shared between the 2 h dichlorvos exposure gene set and the indicated experimental data. The direction of change in gene expression is shown in the left-most column, minus sign/green—down-regulated, plus sign/red—up-regulated.

