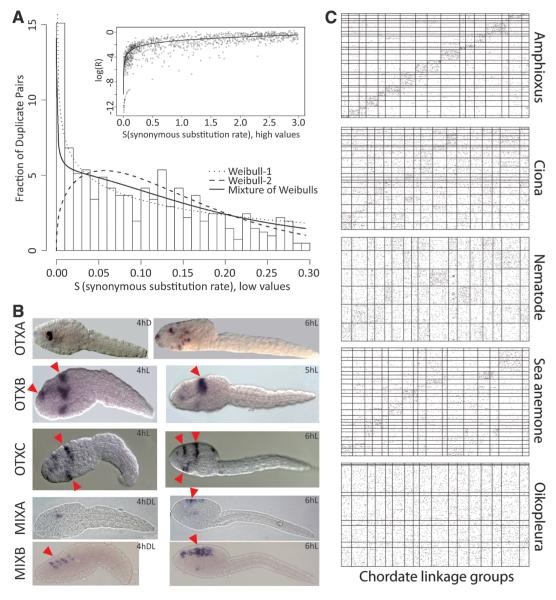
Fig. 3.
Gene duplications and loss of ancestral syntenies. (A) Early gene duplicates. (Main panel) Histogram of binned recent duplicate pairs; a mixture model (discrete distribution plus truncated Weibull distributions) accommodating heterogeneous birth/death processes is fitted. (Inset) Non-synonymous substitution accumulation declines with ongoing synonymous substitution. (B) Expression of amplified homeobox gene groups in the trunk epithelium of larvae (red arrowheads). hD, hours dorsal view; hL, hours lateral view; hDL, hours dorsolateral view. (C) Loss of ancestral gene order. Positions of orthologous genes in a given metazoan genome (y axis) compared with ancestral chordate linkage groups [(CLGs), x axis]. The width of CLGs corresponds to the number of orthologs in a given species. Amphioxus and sea anemone genome segments represent the largest 25 assembled scaffolds, whereas Ciona, nematode, and Oikopleura segments are chromosomes.

