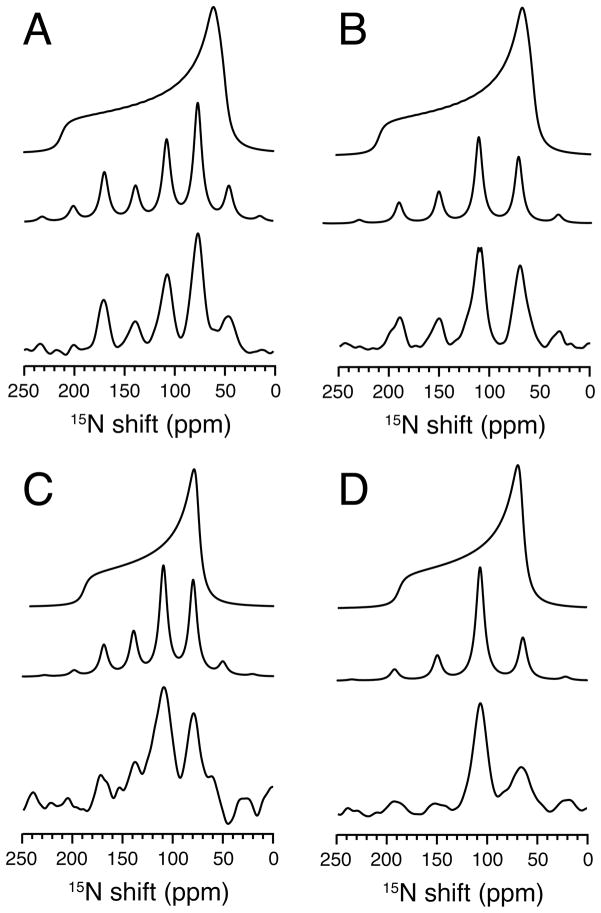
Figure 4.
MAS solid-state 15N NMR spectra of 15N-leucine-11 labeled transmembrane domain of Vpu in unoriented DMPC lipid bilayers (vesicles). A. and B. were obtained at high temperature 30°C. C. and D. were obtained at low temperature 5°C. In each panel the three spectra are: Top: Powder pattern calculated from the experimental sideband intensities. Middle: Sideband intensities ‘back calculated’ from the powder pattern on top. Bottom: Experimental NMR spectrum. The calculated spectra were simulated with δ11=65 ppm, δ22=75 ppm, δ33=217 ppm and δiso=119 ppm and η=0.1 for the low temperature and δ⊥ =82 ppm, δ||=194 ppm, δiso=119 ppm and η=0 for high temperature. The experimental spectra resulted from signal averaging 3000 transients and 6 second recycle delay. The MAS spinning rates were 2.2 kHz for A and C, and 3.0 kHz for B and D.

