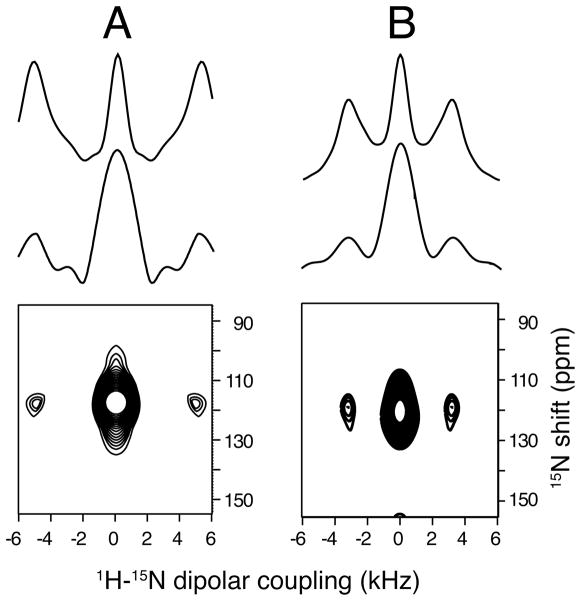
Figure 5.
Two-dimensional MAS SLF spectra of an unoriented 15N-leucine-11 labeled sample of the transmembrane domain of Vpu in unoriented DMPC lipid bilayers (vesicles) obtained with a spinning rate of 7 kHz. A. Low temperature 0°C. B. High temperature 30°C. A. Top: Simulated spectrum for 10 kHz dipolar coupling to match the experimental data. Middle: Slice from experimental spectrum. Bottom: Experimental two-dimensional spectrum obtained from the frequencies observed in the cross-polarization build up curve under Lee-Goldburg irradiation. B. Same as A. except that the simulated spectrum is for 7 kHz dipolar coupling to match the experimental data. 2000 scans and 16 t1 real data points were collected for each two-dimensional spectrum.

