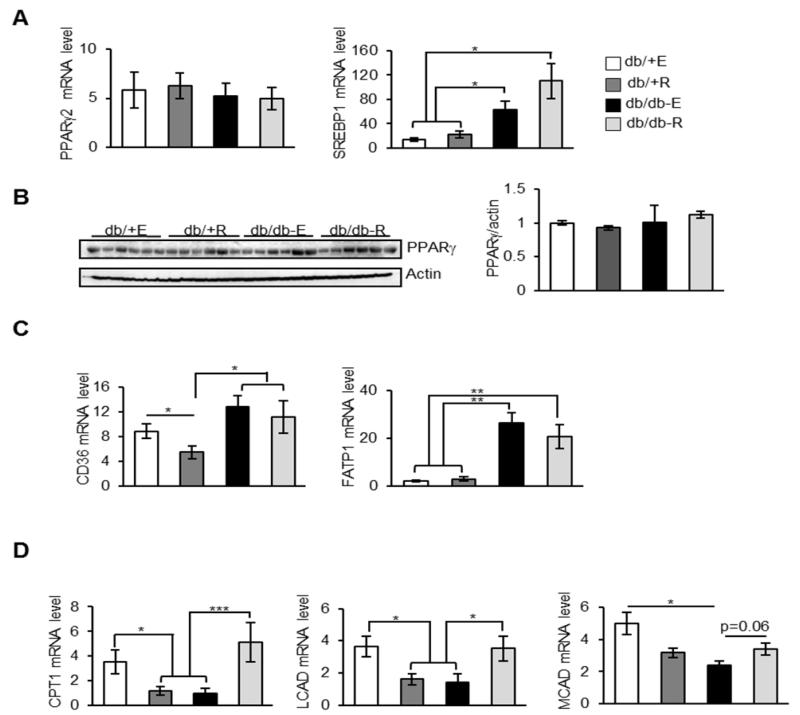
Fig. 2.
Rapamycin feeding does not affect adipogenesis in the WAT of db/db mice. A) mRNA levels of PPARγ2 and SREBP1 in the WAT of db/+ E, db/+ R, db/db-E and db/db-R mice (n=8/group) measured by quantitative RT-PCR, normalized to macroglobulin. B) Left panel: Immunoblots of WAT extract from db/+ and db/db mice fed with eudragit or rapamycin with PPARγ (top panel) and loading control (bottom panel). Right panel: quantification of PPARγ (top panel) to actin. C) mRNA levels of CD36 and FATP1 in the WAT of db/+ E, db/+ R, db/db-E and db/db-R mice (n=8/group) measured by quantitative RT-PCR, normalized to macroglobulin. D) mRNA levels of CPT1, LCAD and MCAD in the WAT of db/+ E, db/+ R, db/db-E and db/db-R mice (n=8/group) measured by quantitative RT-PCR, normalized to macroglobulin.***P < 0.001, **P < 0.01, *P < 0.05.

