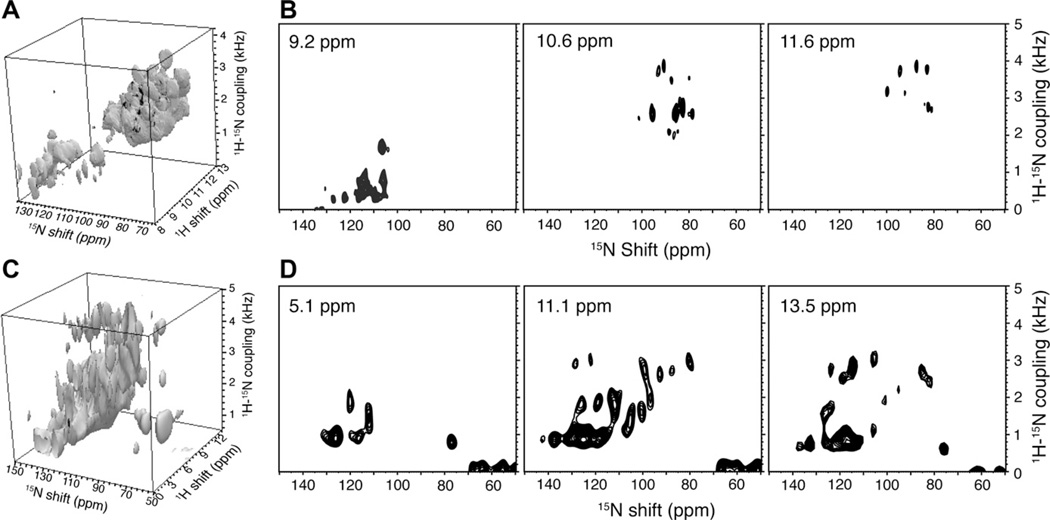
Fig. 8.
Three-dimensional HETCOR/SLF spectra of uniformly 15N labeled membrane proteins in magnetically aligned phospholipid bilayers. (A and C) Cubes displaying the three-dimensional spectra. (A) 81-residue MerFm. (C) 350-residue CXCR1. (B) SLF planes at selected 1H frequencies from the three-dimensional spectrum of MerFm. (D) SLF planes at selected 1H frequencies from the three-dimensional spectrum of CXCR1. The two-dimensional HETCOR pulse sequence shown in Fig. 1B was used to acquire the three-dimensional HETCOR/SLF spectra with the addition of systematic incrementation of the duration of the “mixing” interval of the SAMPI4 pulse [9,25].

