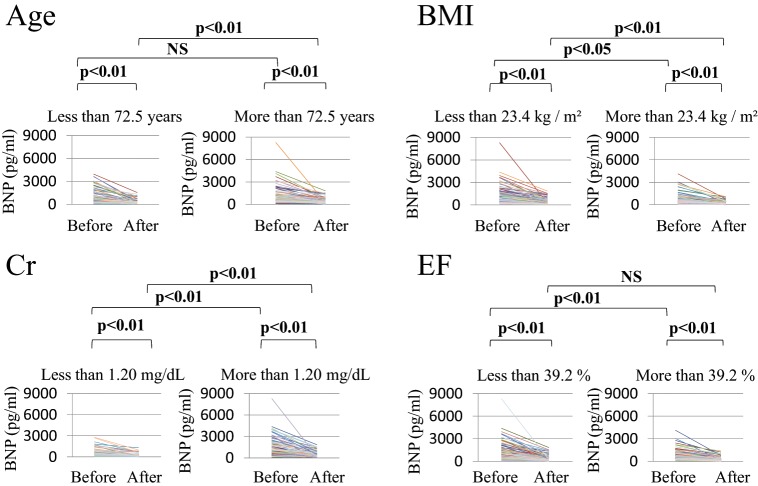
Figure 2.
Changes in plasma BNP levels before and after treatment classified on the basis of median age, BMI, creatinine, and ejection fraction.
The leftmost graph of each pair are for below the median of each clinical factor and the rightmost for above the median.
BMI, Body mass index; BNP, B-type natriuretic peptide; Cr, creatinine; EF, ejection fraction.

