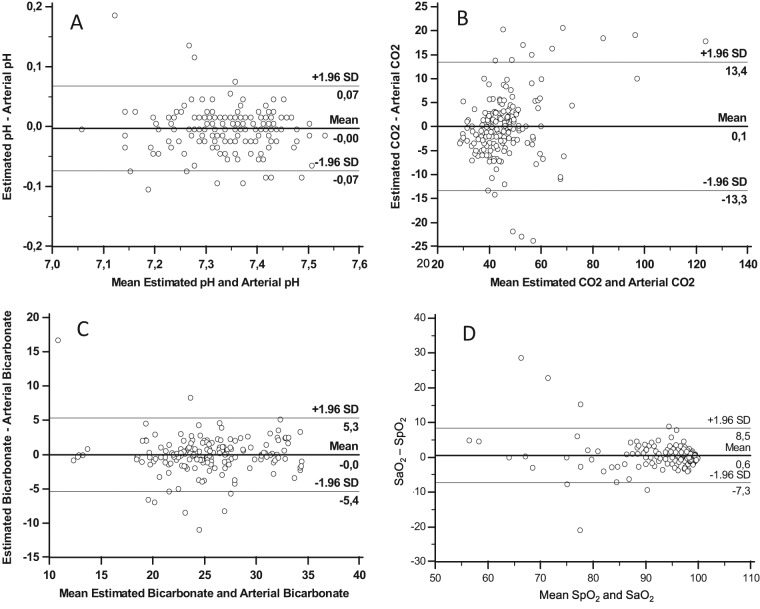
Figure 3.
Bias (Bland−Altman) plots for agreement of (A) ‘estimated arterial’ and arterial pH, (B) ‘estimated arterial’ and arterial pCO2, (C) ‘estimated arterial’ and arterial bicarbonate, and (D) SaO2 and SpO2.
The ‘estimated’ arterial values were empirically obtained from peripheral venous samples (see text).

