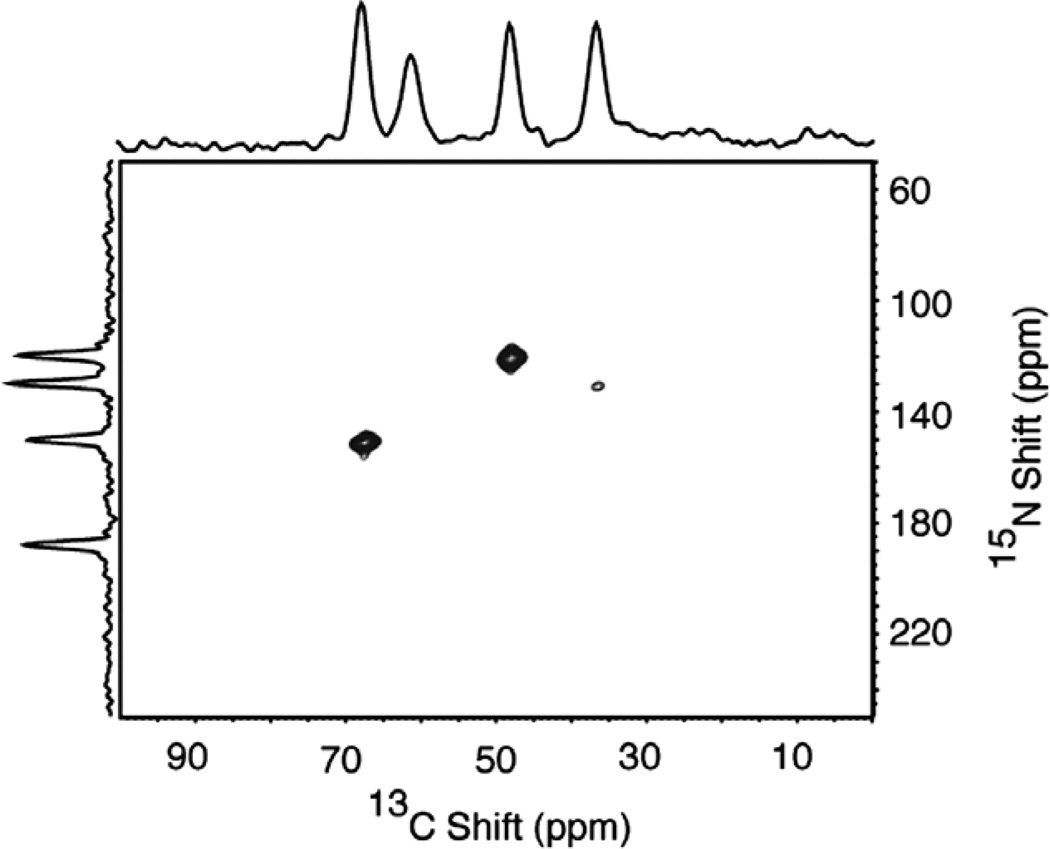
Fig. 10.
Two-dimensional 15N/13C HETCOR spectrum of the 13Cα, 15N labeled single crystal of N-acetyl leucine (13Cα, 15N NAL) obtained using the pulse sequence in Fig. 1e. Four scans for each of 90 t1 points were acquired in the indirect dimension with a dwell of 50 µs. The 1H decoupling field during the t1 and t2 intervals was 50 kHz. The recycle delay used for the experiment was 6 s.

