Fig. 13.
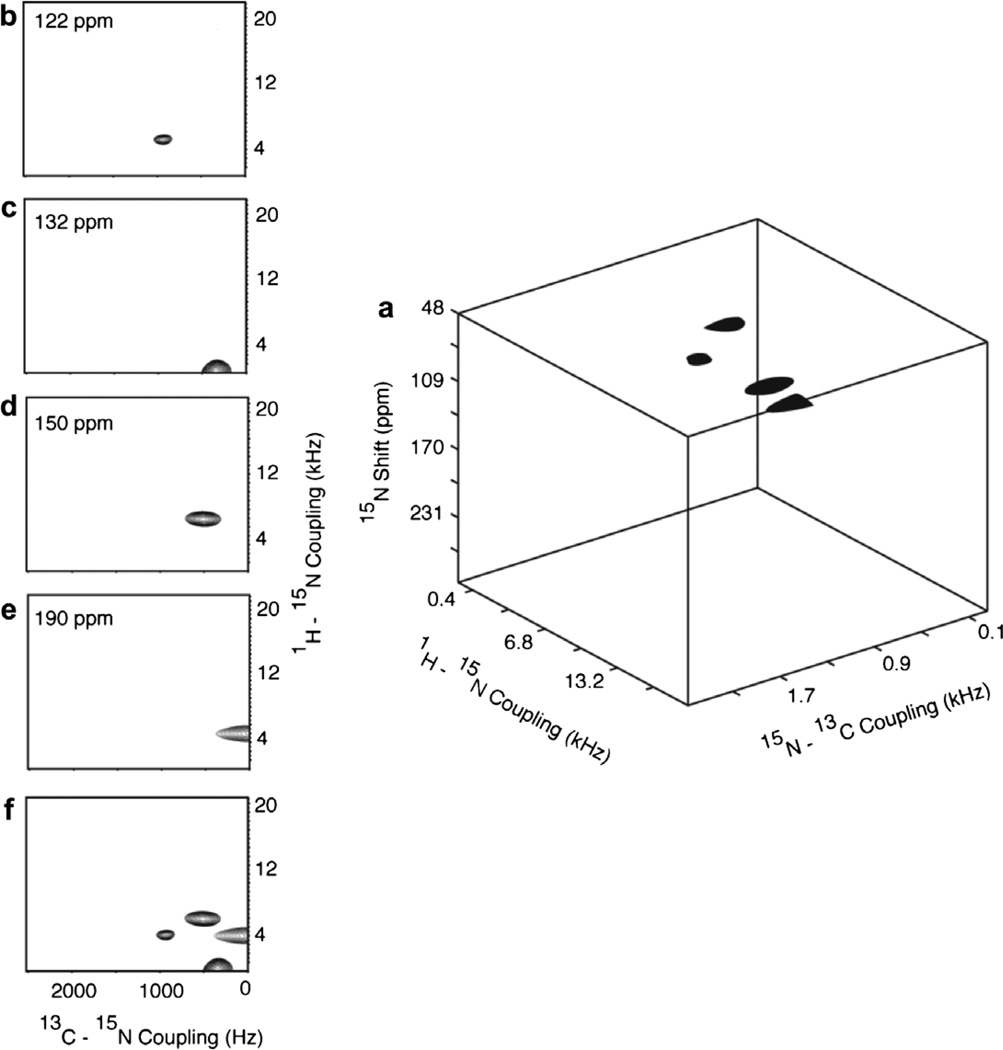
Results from the three-dimensional experiment diagrammed in Fig. 1f that correlates 15N chemical shift/1H–15N dipolar coupling/13C–15N dipolar coupling frequencies performed on the 13Cα, 15N labeled single crystal of N-acetyl leucine (13Cα, 15N NAL). (a) Three-dimensional cube displaying all four resonances. (b)–(e) Two-dimensional planes at 15N chemical shift frequencies containing resonance intensity. (f) Two-dimensional projection. 32 points in the 1H–15N dimensions (spectral width = 40 kHz) and 21 points in the 13C–15N dimensions (spectral width = 5.0 kHz) were acquired with 4 scans.

