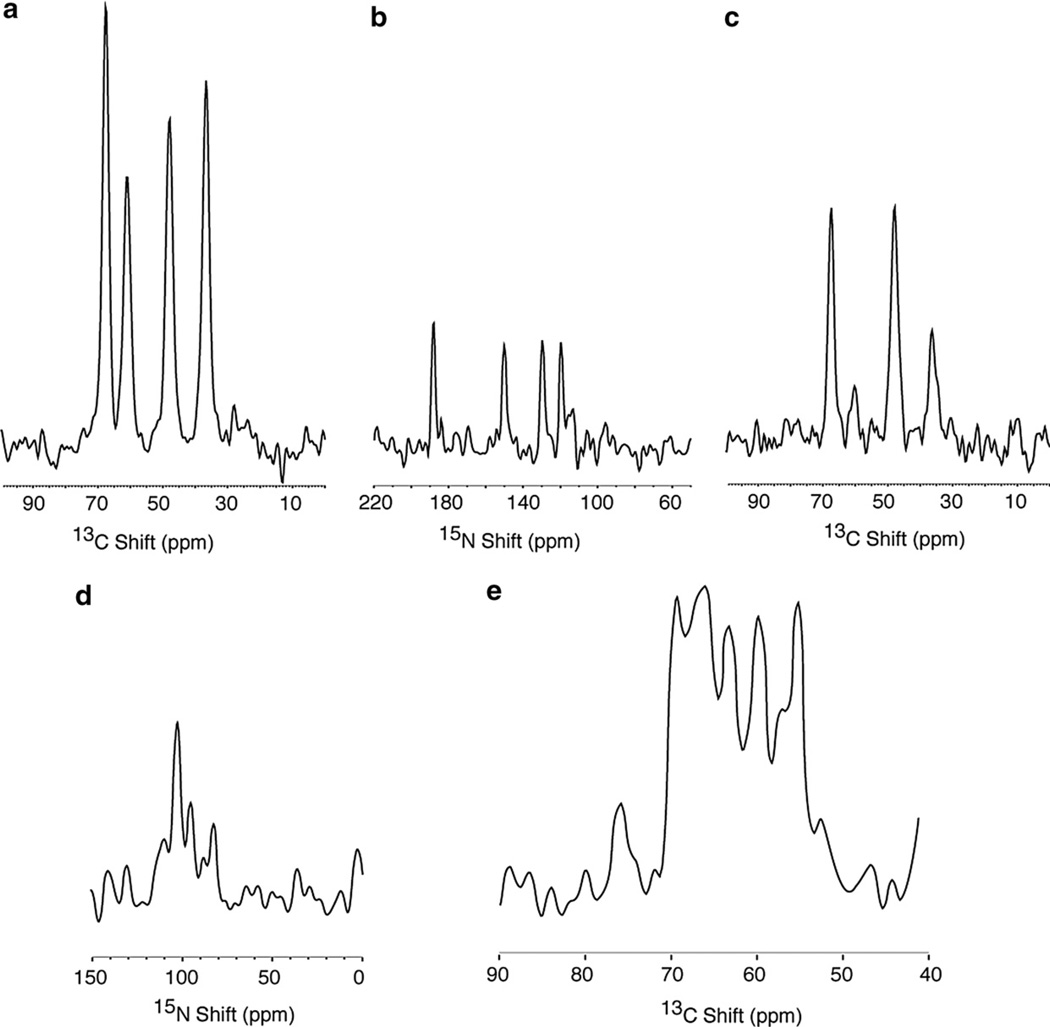
Fig. 2.
Comparison of 13C and 15N detected one-dimensional NMR spectra. (a–c) are from the 13Cα, 15N labeled single crystal of N-acetyl leucine (13Cα, 15N NAL), and resulted from signal averaging 8 scans. The four resonances in the spectrum correspond to the four molecules in the unit cell of the crystal. (d) and (e) are from the Pf1 coat protein in magnetically aligned phospholipid bilayers where the protein is labeled with 13Cα and 15N at all valine, leucine and isoleucine residues (13Cα, 15N VLI Pf1), and resulted from signal averaging 256 scans. The 1H and 15N (or 13C) decoupling fields applied during data acquisition were 50 kHz. All of the cross-polarization mix times were 1 msec and the recycle delays 6 s. (a) 13C detection following cross-polarization. (b) 15N detection following cross-polarization. (c) 13C detection following double-cross-polarization. (d) 15N detection following cross-polarization. (e) 13C detection following cross-polarization.

