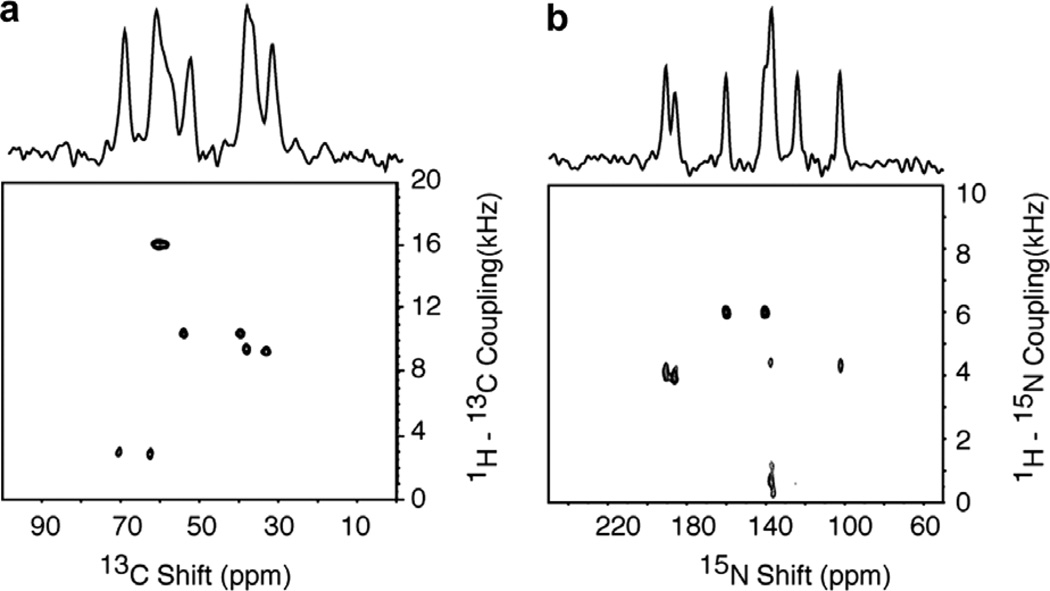
Fig. 9.
Two-dimensional PISEMA spectra of the 13Cα, 15N labeled single crystal of N-acetyl leucine (13Cα, 15N NAL). (a) 1H–13C PISEMA spectrum obtained without 15N decoupling during acquisition (t2). (b) 1H–15N PISEMA spectrum obtained without 13C decoupling during acquisition (t2). For the 2D spectrums, 4 scans were added for each t1 points (128). During spin exchange period, 55 kHz power level on the 1H channel were used. The two-dimensional data sets were zero filled to 1K data points and multiplied by sine bell window function before double Fourier transformation. The one-dimensional 13C (a) and 15N (b) NMR spectra obtained without decoupling of the unobserved nucleus are aligned along the corresponding two-dimensional spectra.

