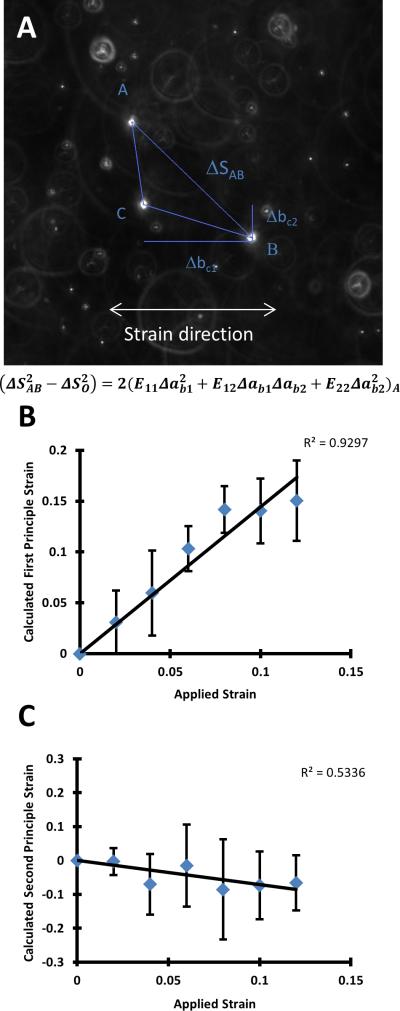
Figure 2.
Relationship between applied strain and strain within the fibrin gel. A. Representative image of a triad used in strain calibration. A system of equations was solved for E11, E12, and E22, which were used to calculate the principle strains. Shown are the first (B.) and second (C.) principle strains within the fibrin matrix. 15 triads were used for this analysis.

