Figure 1.
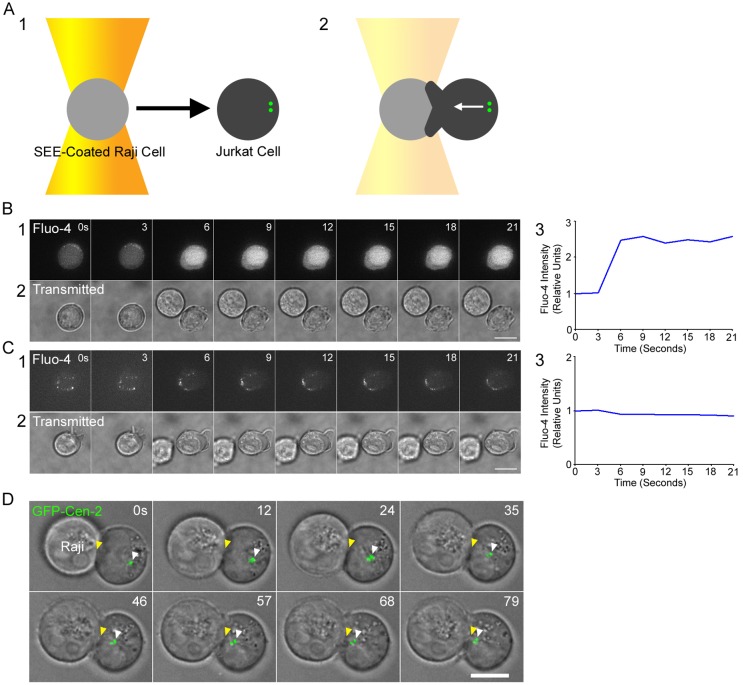
Optical trap–based system for quantitating MTOC repositioning in Jurkat–APC conjugates. (A) Cartoon showing the optical trap–controlled presentation of a SEE-coated Raji cell to a centrosome-marked Jurkat T cell (A1) resulting in MTOC repositioning to the site of contact (A2). Note that the MTOC in unengaged T cells is typically near the cell edge because the nucleus fills most of the cell’s volume. (B and C) Jurkats conjugated to SEE-coated Raji cells (B) but not uncoated Raji cells (C) exhibit robust calcium flux immediately after optical trap–controlled contact (B1 and C1, Fluo-4AM signals; B2 and C2, transmitted images; B3 and C3, total cellular Fluo-4AM signals after contact with the Raji cell). (D) MTOC repositioning in a representative Jurkat immediately after optical trap–controlled engagement with a SEE-coated Raji cell (follow the yellow [IS] and white [green MTOC] arrowheads; see also Video 1). Bars, 10 µm.

