Figure 3.
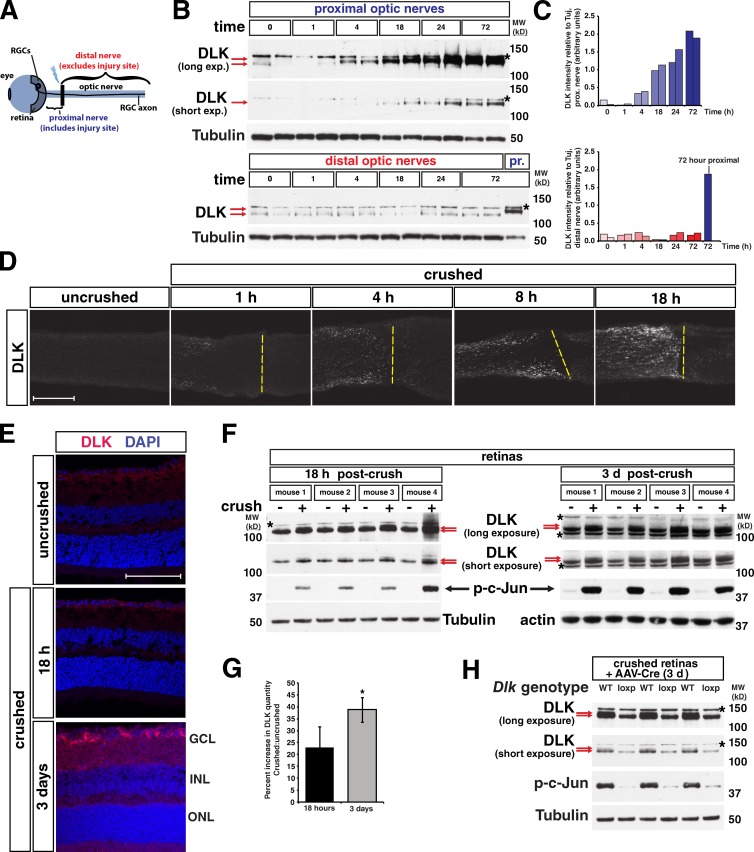
Elevation of DLK protein levels occurs first in the axon after optic nerve crush and then progresses to cell bodies. (A) Diagram of the retina nerve crush model showing location of the retina, crush site (black bar), proximal nerve, and distal nerve. RGCs, retinal ganglion cells, located in the ganglion cell layer (GCL) of the retina. (B) Within the crushed nerve, DLK undergoes a stress-dependent increase in molecular weight and abundance by 4 h post-crush and is notably increased by 18 h. The shift in DLK mobility (red arrows) and increase in DLK quantity can be observed after injury only in the proximal (top) but not the distal nerve (bottom). Asterisk: a background band observed in nerve lysates blotted for DLK (see Fig. S1). A proximal nerve sample collected 72 h after injury is included in the distal nerve blot for comparison. (C) Quantification of the DLK intensity relative to tubulin intensity for each well shown in B. n = 2 animals/time point. (D) Time course showing the increase in DLK quantity in the optic nerve after injury by immunostaining for DLK. Yellow dashed lines: approximate location of crush site. The increase in DLK is limited to the proximal nerve that lies to the left of the line. (E) In the retina, no increase in total DLK is observed by staining at 18 h post-crush, but by three days an increase in DLK is visible. Magenta, DLK staining; blue, DAPI nuclear stain; GCL, ganglion cell layer; INL, inner nuclear layer; ONL, outer nuclear layer. (F) Blots for DLK in crushed retinas and contralateral uncrushed controls 18 h and 3 d after nerve crush. Red arrows denote the lower molecular weight DLK and the appearance of a small amount of the higher molecular weight band at 18 h and a more prominent higher molecular weight band at 3 d. Asterisk denotes background bands. (G) Quantification of the percent increase in DLK in crushed retina vs. uncrushed retina at the given times in the blots shown in F. 18 h = 23.02 ± 8.39. 3 d = 38.68 ± 5.27. *, P = 0.028 by t test. n = 4 animals for each time point. Error bars are SD. (H) Blots of retina lysates 3 d after nerve crush from wild-type (WT) and Dlklox/lox (loxp) mice injected with AAV-Cre virus. The DLK mobility shift is seen in WT retinas in the form of a doublet (red arrows), but not in loxp mice. Because only RGCs were transduced with AAV-Cre virus in loxp mice, the top band (red arrow) that appears with retina nerve crush represents phosphorylation of DLK specifically in RGCs and not other cell types of the retina. Bars, 100 µm. MW (kD), molecular weight in kilodaltons.

