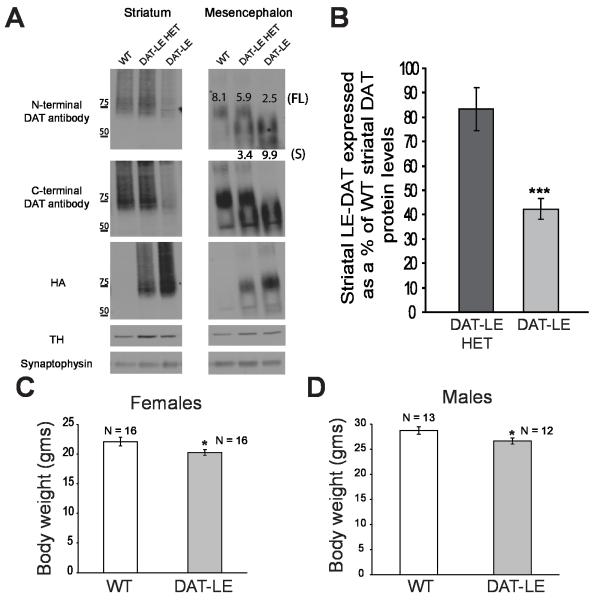
Fig. 1. Characterization of DAT protein levels and body weights of DAT-LE mice.
(A) Representative western blots of striatal (left panel) and mesencephalic tissue (right panel) from mice of all three genotypes (WT, DAT-LE HET and DAT-LE). Striatal lysates or mesencephalic immunoprecipitates using DAT-specific antibodies were electrophoresed and probed by blotting with antibodies to DAT (both against the N- and C-termini), HA, TH and synaptophysin (loading control). The molecular weight markers in kilodaltons are indicated to the left of the striatal blot. The values shown on the mesencephalic blots are the calculated signal intensity (in AU) of mesencephalic DAT protein relative to TH protein levels. The values at the top correspond to the higher molecular weight full-length (FL) DAT (~75 KDa) while the values at the bottom correspond to the short (S) form of DAT (~60 KDa), denoted as FL and S, respectively, on the right side of the blot. (B) Relative intensity of striatal tissue DAT western blot signals, as detected by the N-terminal DAT antibody, in the DAT-LE HET and DAT-LE animals expressed as a percentage of the WT animals. The DAT signal intensity was normalized to that of the TH levels. Mean values ± SEM (N = 4; *** p<0.001 DAT-LE vs. DAT-LE HET). (C & D) Body weights of adult (2-4 mo) female (C) and male (D) DAT-LE mice compared to their WT littermates. Mean values ± SEM (N = 12-16; * p<0.05, DAT-LE vs WT).

