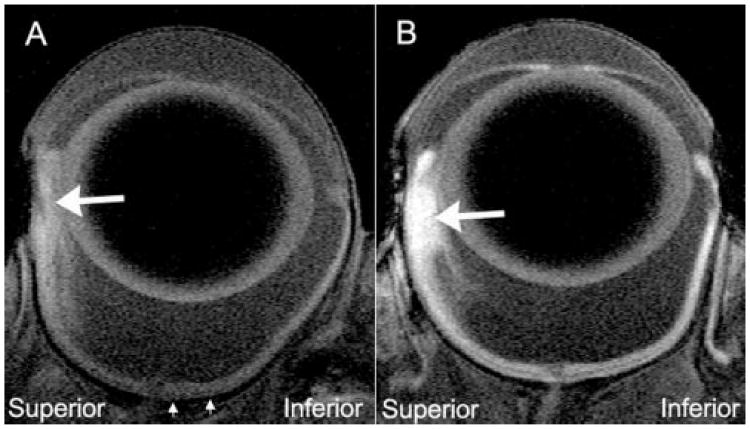
Figure 2.
Representative high-resolution MRIs of tumor-bearing eyes 4 hours after IP saline injection (A) or MnCl2 injection (B). Comparison of peripheral superior and inferior retina clearly identifies the tumors (large arrows). The tumor areas were (A) 1.54 and (B)1.87 mm2. The average intensities of these tumors were (A) 122.1 AU and (B) 167.5 AU. Note that the data in Figure 3 was derived from the region of inferior retina located between the small arrows.

