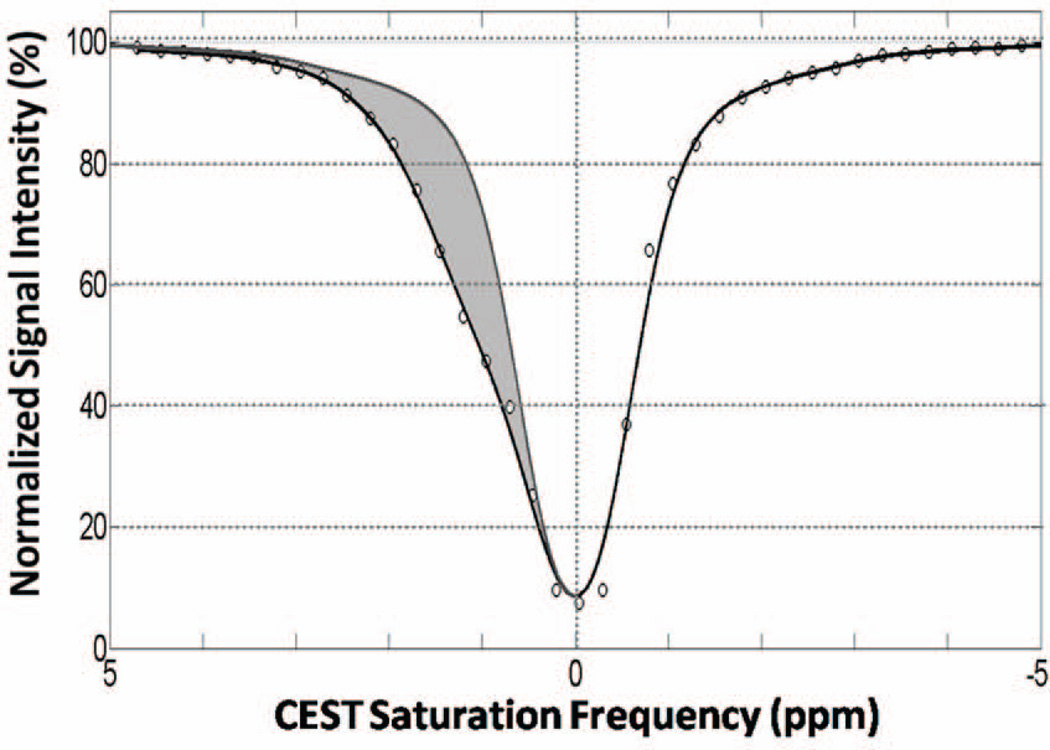
Figure 2.
Representative CEST z-spectra and analysis. Normalized signal intensity data from a selected region of interest is shown in the open circles along with the smoothing spline fit (solid line). The net CEST effect is determined by comparing the asymmetry in the modeled z-spectra (shaded region) and is integrated as the CEST Asymmetry Area.

