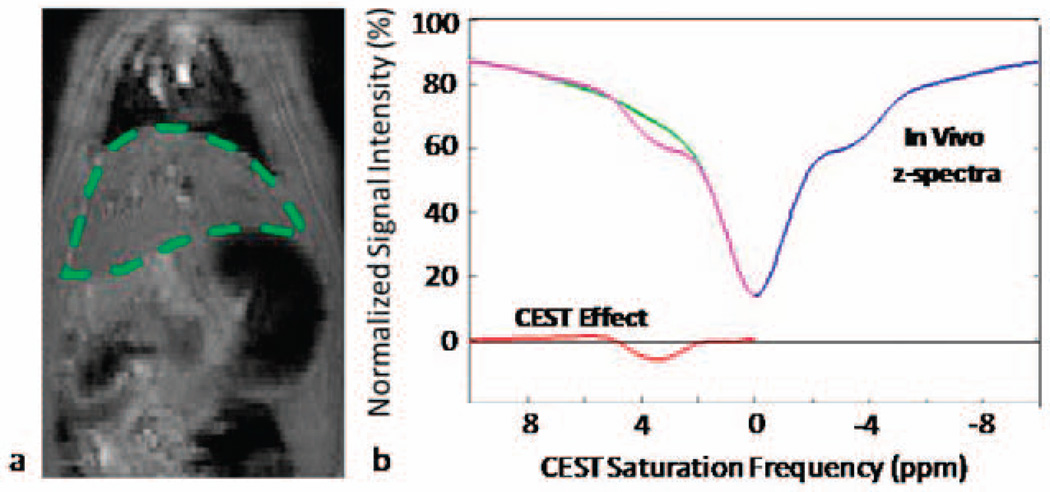
Figure 6.
Preliminary in vivo CEST-FISP results. (a) Representative coronal CEST-FISP image of a 3-month old male Sprague-Dawley rat. (b) CEST-FISP z-spectra results of rat liver (green ROI in (a)). A negative CEST effect is observed at 3–5 ppm due to the large asymmetry observed in the z-spectra (blue and green lines) most likely due to direct suppression of liver lipids.

