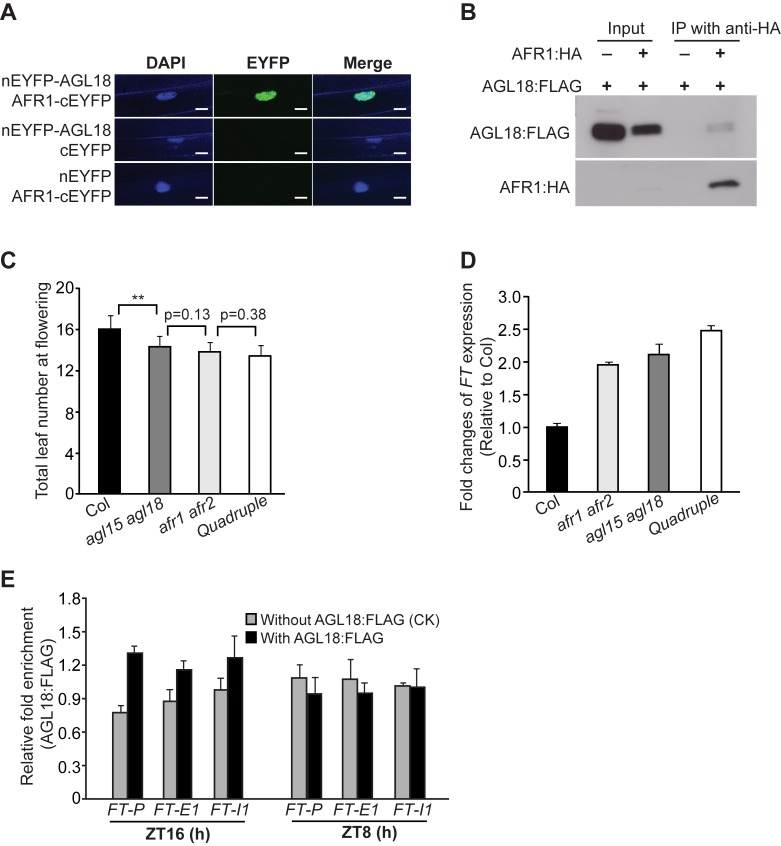
Figure 6. AGL18 directly interacts with AFR1 and binds to FT chromatin at the day's end in LDs.
(A) BiFC analysis of the interaction of AGL18 with AFR1 in onion epidermal cells. Yellowish-green signals indicate the physical association of AGL18 with AFR1 in the nuclei (indicated by the blue fluorescence from DAPI). Bar = 20 µm. (B) Co-immunoprecipitation of AFR1 with AGL18 in Arabidopsis seedlings. Total protein extracts from F1 seedlings of the doubly hemizygous AGL18:FLAG and AFR1:HA, were immunoprecipitated with anti-HA agarose; subsequently, the precipitates were analyzed by western blotting with anti-FLAG (recognizing AGL18:FLAG) and anti-HA (recognizing AFR1:HA). (C) Flowering times of the indicated genotypes grown in LDs. 12–16 plants were scored for each line. Double asterisks indicate a statistically significant difference in the means between Col and agl15 agl18, as revealed by two-tailed Student's t test (**, p<0.01). Bars indicate SD. (D) Relative FT transcript levels in the seedlings of indicated genotypes at ZT16, quantified by qRT-PCR. The transcript levels were first normalized to UBQ10, and relative fold changes to Col are presented. Bars indicate SD of triplicate measurements. One of two biological repeats with similar results is shown. (E) ChIP analysis of AGL18:FLAG enrichment at the FT locus. Amounts of immunoprecipitated genomic fragments were measured by qPCR, and normalized first to the endogenous control TUB8. The fold enrichment of AGL18:FLAG in each examined region (at each time point) was calculated by dividing the TUB8-normalized amount of examined region from the AGL18:FLAG-expressing line, by that of WT (without AGL18:FLAG) at each time point. Error bars indicate SD of triplicate measurements. A biological repeat of this analysis is presented as Figure S13B.

