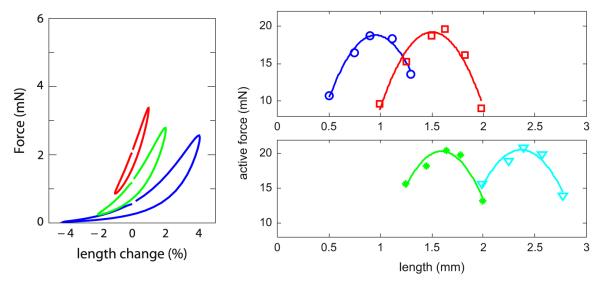
Fig. 1.

Characteristic ASM behaviours. Left panel: Force–length loops, data from Bates et al. (2009). These force measurements are taken with length oscillations imposed with amplitude 1, 2 and 4% of reference length and frequency 2 Hz. Right panels: Force–length curves and adaptation, data from Wang et al. (2001) with best-fit quadratics. Here in the top (bottom) panels the muscle is passively shortened (lengthened) to a new adapted length and allowed to re-equilibrate over 24 h. At each adapted reference length, the characteristic (1−L2) shape is observed, with adaptation simply shifting this shape left and right along the length axis. Peak force for each adapted length is roughly constant.
