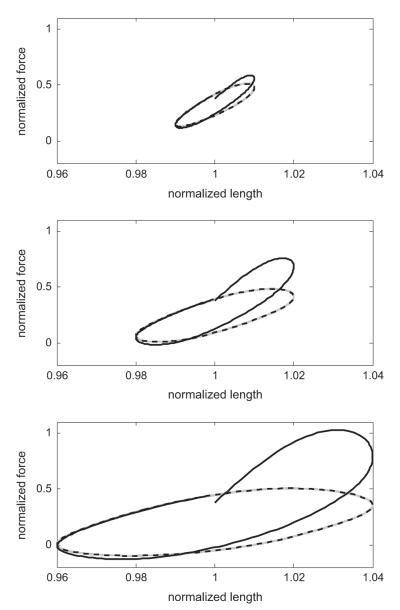
Fig. 4.
Force–length loops: short timescale. Model simulations of force–length loops at 2 Hz, with amplitudes 1%, 2% and 4% of reference length from top to bottom. The first loop is given in solid black, subsequent loops in grey, and the 40th loop in dashed black. The loops illustrate the typical hysteresis seen experimentally (see, i.e. Fig. 1 or Bates et al., 2009) and in crossbridge models (Mijailovich et al., 2000).

