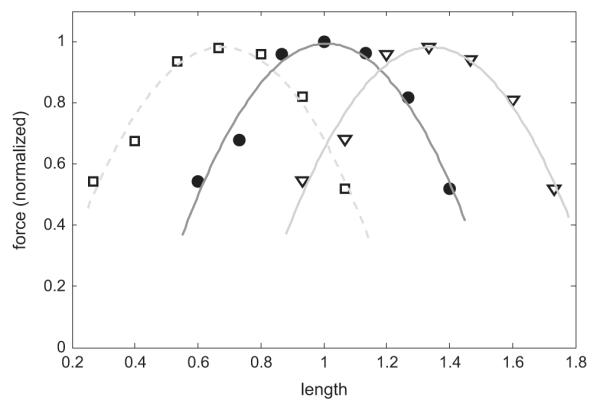
Fig. 6.

Length adaptation: long timescale. Here the model is allowed to re-equilibrate to a new length over a period of 24 h; after this, the protocol in Fig. 5 is repeated about this new length. The solid dots are as in Fig. 5; measurements relative to the shortened length are given in the unfilled squares; measurements relative to the lengthened tissue are the inverted triangles. In each case a best fit quadratic is given in grey. The model illustrates the characteristic parabolic shape at each new length, and the peak force of each curve is roughly constant.
