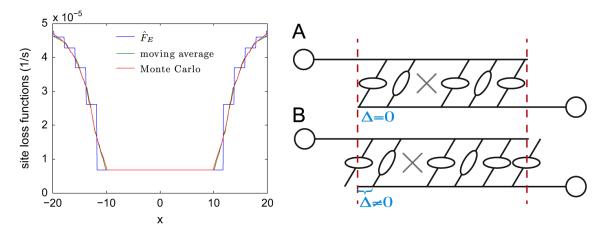
Fig. B1.

Left panel: The site loss function FE, directly calculated by Monte Carlo simulation and approximated by a moving average. Right panel: Illustration of alignment between filament overlap region and binding sites. Here configurations A and B have identical overlap regions, but different alignments (Δ = 0 in A, and Δ≠0 in B). The site loss function is computed as an average over all possible alignments.
