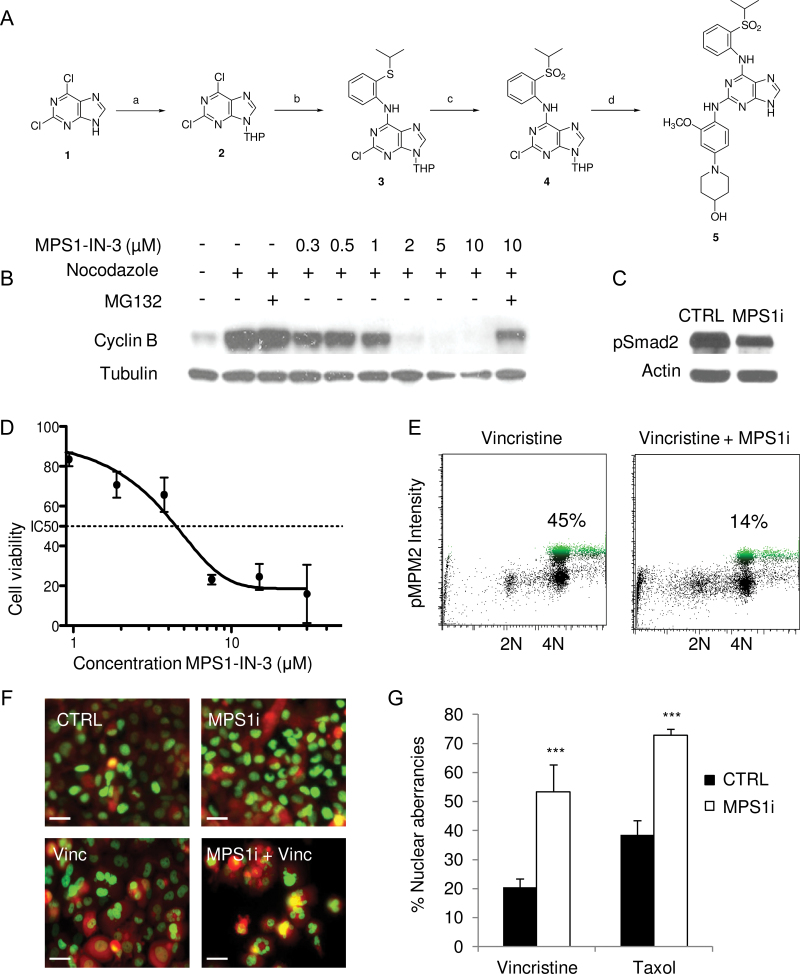
Figure 3.
Development of the selective and potent MPS1 inhibitor MPS1-IN-3. A) Chemical development of MPS1-IN-3. Compound 1—2,6-dichloro-9H-purine—was first converted by reaction a to compound 2—2,6-dichloro-9-(tetrahydro-2H-pyran-2-yl)-9H-purine—then by reaction b to compound 3—2-chloro-N-(2-(isopropylthio)phenyl)-9-(tetrahydro-2H-pyran-2-yl)-9H-purin-6-amine—and reaction c to product 4—2-chloro-N-(2-(isopropylsulfonyl)phenyl)-9-(tetrahydro-2H-pyran-2-yl)-9H-purin-6-amine—to finally reach desired product 5 by reaction d—1-(4-(6-(2-(isopropylsulfonyl)phenylamino)-9H-purin-2-ylamino)-3-ethoxyphenyl)piperidin-4-ol (MPS1-IN-3). Reactions, reagents, and conditions are described in the Supplementary Experimental Procedures (available online). B) Western blot analysis of cyclin B in U2OS cells treated with nocodazole, MPS1-IN-3, and/or MG132. C) Western blot analysis of Smad2 phosphorylation in U251 cells incubated with 5 μM of MPS1-IN-3 (MPS1i) and vincristine. D) Dose–response curve of MPS1-IN-3 on U251 glioblastoma cells as analyzed by cell counts. Data shown as average ± standard deviation. E) Fluorescence activated cell sorting analysis of pMPM2 in U251 cells 24 hour after addition of 5 μM of MPS1-IN-3 (MPS1i) and vincristine. Percentages indicate cells in mitotic arrest. F) U251-FM-H2B-GFP cells were treated with DMSO (CTRL) or MPS1-IN-3 (MPS1i) in combination with vincristine or taxol. The nuclear morphology was assessed with fluorescence microscopy and quantitated in (G). Scale bar = 10 µm. The experiment was performed in triplicate. Shown are mean averages, and error bars indicate standard deviation.

