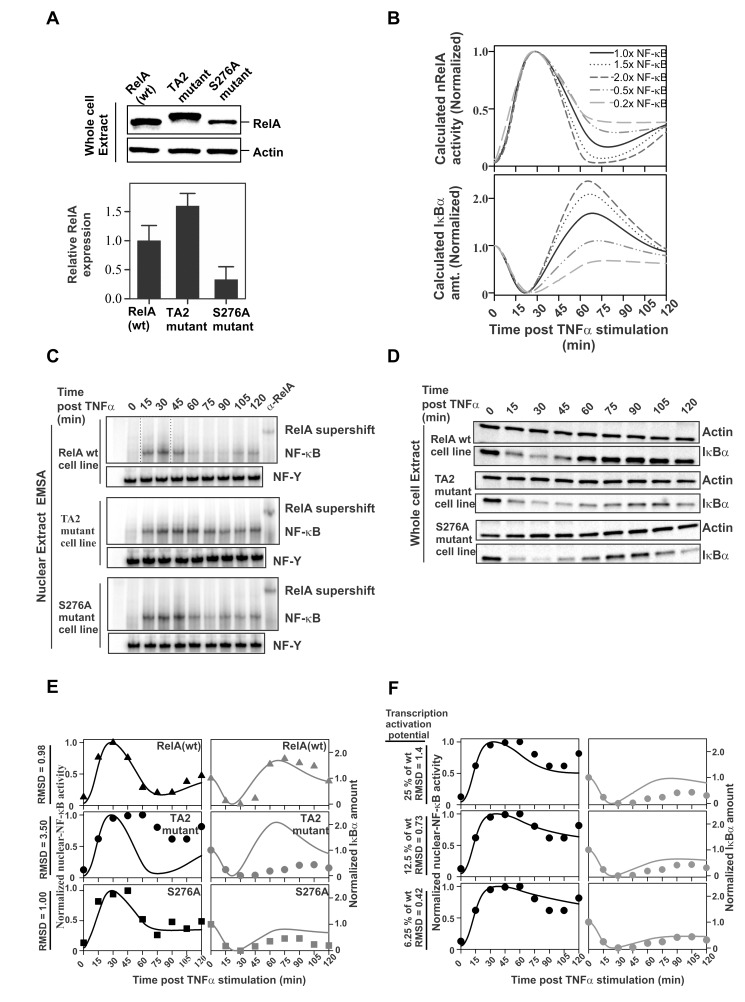
Figure 6. Impaired RelA–TA2:CBP–TAZ1 interaction disrupts the negative feedback loop of the NF-κB pathway.
(A) Expression of RelA mutants with respect to RelA(wt) in the RelA reconstituted rela −/− cell lines. The protein expression levels of RelA(Ser276Ala) mutant was about three times lower than that for RelA(wt). For the quantitative estimation, the RelA to Actin signal ratio for each cell line was normalized with that for the RelA(wt) reconstituted rela −/− cells (lower panel). (B) Model predictions for NF-κB (top) and total IκBα abundance (bottom) for different RelA expression levels (2×, 1.5×, 1×, 0.5×, and 0.2× relative to RelA(wt) values). In the nNF-κB curves, the peak is normalized to one for the highest level of nNF-κB activity and to zero for its levels in the resting cells (time = 0 min) for each individual expression level. Similarly, for the IκBα curves, the amount of IκBα in the resting cell (time = 0 min) is normalized to one and the minimum amount after degradation (basal levels) to zero following TNFα stimulation. (C) nRelA activity assay in response to TNFα stimulation as measured by EMSA using labeled κB probe and control NF-Y probe in the above-mentioned cells. The activity due to RelA binding to the κB probe was indicated by supershift of the EMSA band corresponding to the probe-bound NF-κB detected with anti-RelA antibody. 12 µg of NE was used for EMSA. (D) IκBα degradation and regeneration assay in RelA(wt/mutants) reconstituted rela −/− cells following TNFα stimulation. IκBα protein levels after stimulation were monitored with respect to Actin. (E) Comparison of experimentally determined (symbols) and model predictions (solid line) based on adjusted RelA levels for NF-κB (left) and total IκBα abundance (right). Time courses for rela −/− cells reconstituted with RelA(wt) (top), RelA(TA2) mutant (middle), and RelA(Ser276Ala) (bottom) stimulated with TNFα are shown. The experimental data were normalized as mentioned in panel (B) of this figure. The RMSD values correspond to the combined NF-κB and IκB datasets. (F) Comparison of experimentally determined (•) and model predictions (solid line) for NF-κB (left column) and total IκBα abundance (right column) for different degrees of suppression of IκBα mRNA production for RelA(TA2) mutant reconstituted rela −/− cells.

