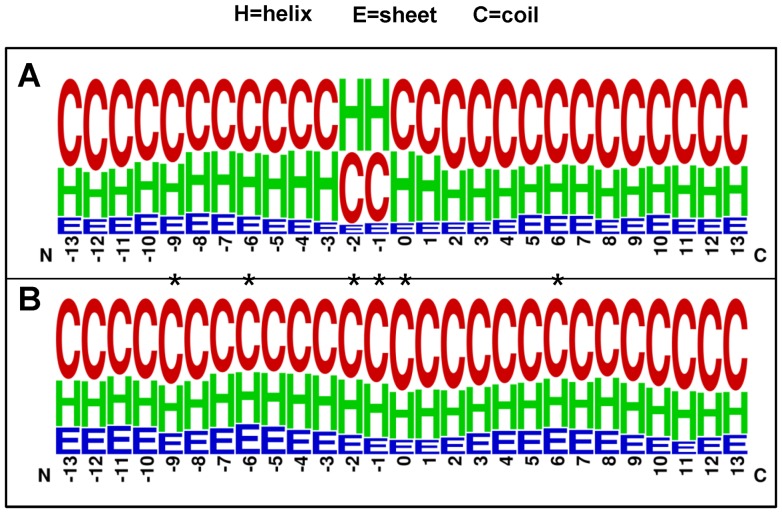
Figure 2. A weblogo of secondary structure of pupylated sequences (A) and non-pupylated sequences (B).
P-values were calculated using the Welch’s t-test (two tails). *The compositional biases of secondary structure are statistically significance (P<0.001) comparing pupylated sequences with non-pupylated sequences.

