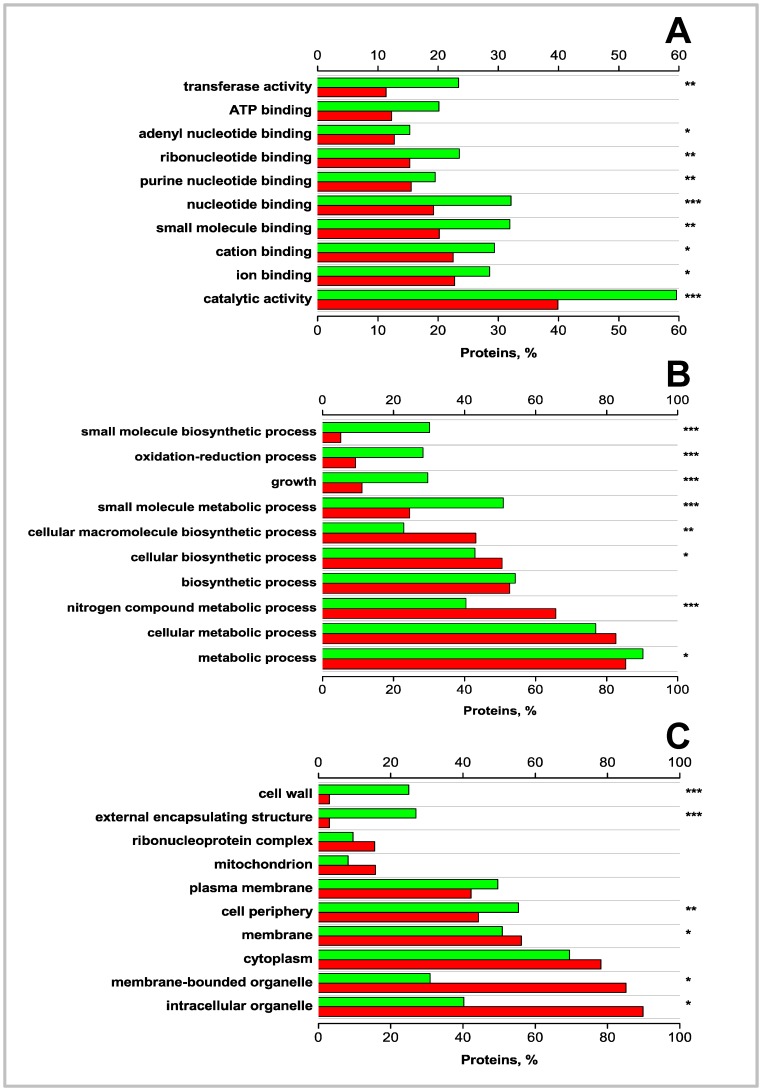
Figure 6. GO annotations for the highly pupylated proteins from prokaryotes proteome (red bars) with occurrence of >5% (Bonferroni corrected) as compared to the highly ubiquitylated proteins from eukaryotes proteome (green bars).
Top 10 (whenever available) GO Slim terms are shown. (A) Molecular function; (B) Biological process; (C) Cellular component. The proteins are arranged in order of the decreasing fraction of proteins with a specific GO annotation present in the predicted highly pupylated dataset. P-values were calculated using the Fisher’s exact test (two tails) and corrected for multiple testing. ***P<0.0001; **P<0.001; *P<0.05.

