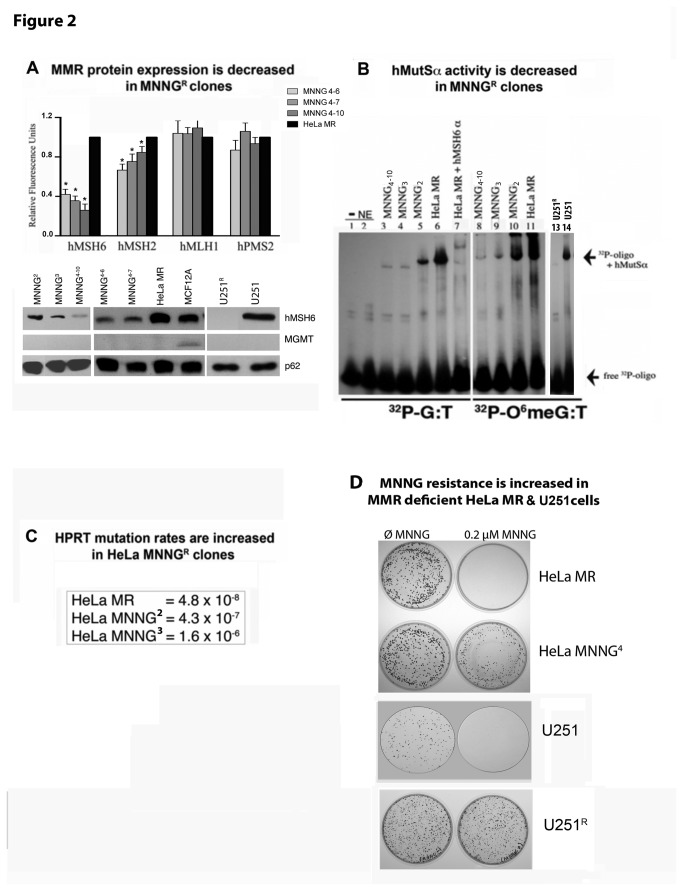
Figure 2. MMR protein expression and hMutSα activity decreases while hprt mutation rates and MNNG resistance increases in MGMT and MMR negative subclones after repeated exposure to MNNG.
A. MMR protein expression, each fluorescent protein band was measured against a loading control (p62) in the same lane by Alpha lnnotech Fluorochem HD2, histograms produced by Prism GraphPad software, error bars indicate SD. U251 not represented in histogram because hMSH6 and hMSH2 expression is completely absent (Figure 1). Asterisks (*) denote statistically significant differences at P < 0.05 between each subclone protein expression and HeLa MR for the designated MMR protein. Statistical significance determined by student t-test using Prism GraphPad software. Each experiment was performed a minimum of 3 times. B. hMutSα binding activity of equal nuclear protein concentration from nuclear extracts of each cell line by EMSA using [32P]-69mer oligomers with either G:T or 06meG:T located in the center. C. hprt mutation rates in two sequentially isolated HeLa MNNGR clones as compared to HeLa MR. D. Classic colony survival of HeLa MNNG4 and U251R subclones indicates significant resistance to 0.2 µM MNNG as compared to HeLa MR and U251 parental cell lines.

