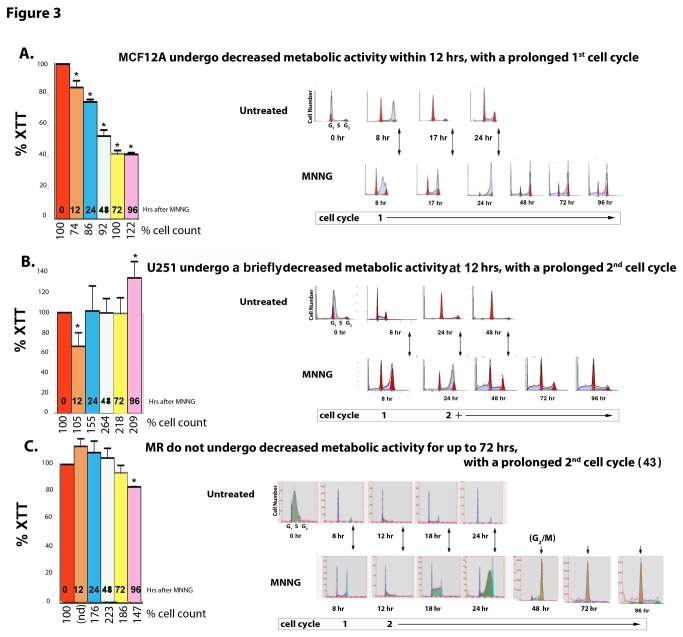
Figure 3. Normal (MCF12A) and cancer (U251 and HeLa MR) cells exhibit very different metabolic (XTT), proliferative, and cell cycle effects after MNNG exposure.
All 3 cell lines were subjected to measurements of metabolic activity (XTT histograms produced by Prism GraphPad software, error bars indicate SD), cell counts (% cell count), and cell cycle analysis (flows of DNA content) up to 96 hr post MNNG-treatment (A–C). Each cell line was subjected to an equitoxic concentration of MNNG that resulted in 0% colony survival. Asterisks (*) denote statistically significant differences at P < 0.05 between the metabolic rate measured at that time point and the 0 hr (untreated) metabolic rate of each cell line. Histograms produced by Prism GraphPad software, error bars indicate SD. Statistical significance determined by student t-test using Prism GraphPad software. Each experiment was performed a minimum of 4 times. A. MCF12A normal cells = 8 µM MNNG, B. U251 glioblastoma and C. HeLa MR cell lines = 0.2 µM MNNG. HeLa MR cells cycle events at specific time points after MNNG treatment have been previously published [43].

