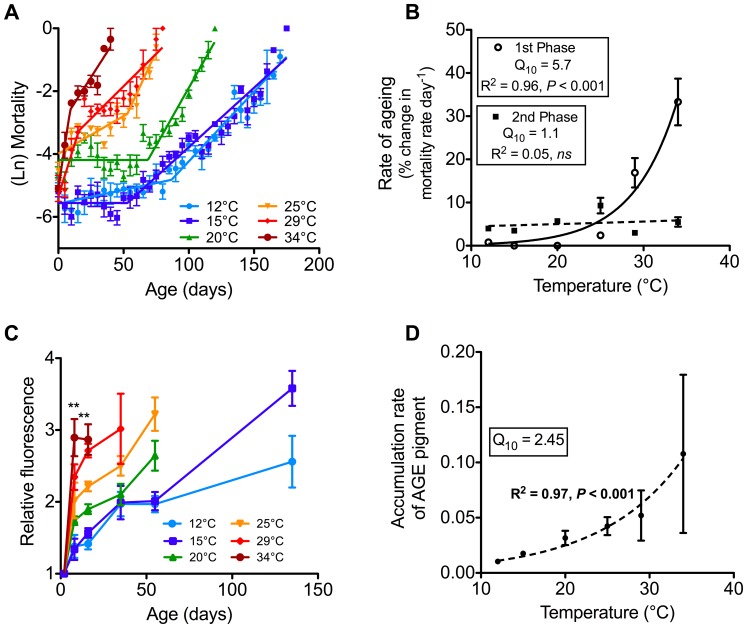
Figure 4. Demographic and cellular senescence of adult Calliphora stygia maintained at different ambient temperatures.
(A) A two-phase Gompertz was fitted to daily log-transformed mortality by segmental regression and is represented by the solid line for each temperature (see Table 2 for parameters). Data are pooled from replicate cages, with plotted points being the average of a five-day period, with error bars ± one SEM (N = 12°C = 685, 15°C = 733, 20°C = 742, 25°C = 746, 29°C = 618, and 34°C = 778). (B) The exponential relationship between 1st and 2nd-phase rate of ageing and temperature. Data points are the average (± one SEM) rate of ageing during 1st- and 2nd-phases of ageing. (C) Fluorescent AGE pigment accumulation with chronological age for each temperature treatment. Values are means ± SEM (N = 6). ** represents a significant difference between temperatures at that age. (D) Temperature sensitivity of AGE pigment as described by the Q 10 of the rate of accumulation of fluorescent AGE pigment. Data points are the means ± SEM of the rate of accumulation at each temperature.

