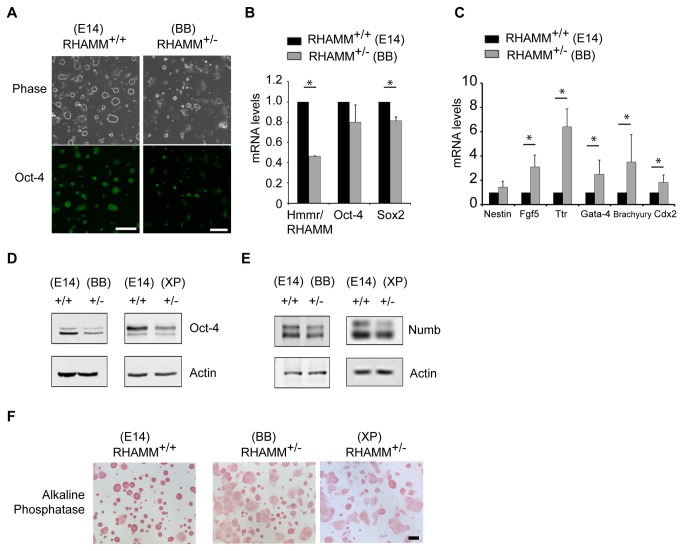
Figure 2. Genomic loss of RHAMM attenuates pluripotency and augments differentiation in mouse ES cells.
(A) ES cell colonies are flatter and immunofluorescence detection of the pluripotency marker Oct-4 is reduced in feeder-free cultures of RHAMM+/- mouse ES cells (BB0166). Scale bar: 200 µm. (B) Quantitative RT-PCR analysis of the expression levels for markers of pluripotency in RHAMM+/- mouse ES cells. All expression levels were first normalized to internal GAPDH control levels, and then mRNA expression levels in RHAMM+/- ES cells were normalized to the respective levels in RHAMM+/+ ES cells. Data are mean ± SD, n = at least duplicate experiments, * p< 0.05 for two-tailed, pairwise Student’s t test; p(Oct-4) = 0.07. (C) Quantitative RT-PCR analysis of the expression levels for markers of lineage differentiation in RHAMM+/- mouse ES cells. All expression levels were first normalized to internal GAPDH control levels, and then mRNA expression levels in RHAMM+/- ES cells were normalized to the respective levels in RHAMM+/+ ES cells. Data are mean ± SE, * p< 0.05 for two-tailed, pairwise Student’s t test, n = triplicate experiments; a fourth experiment was performed and the results are shown in Figure S3. (D) Western blot analysis of whole cell lysates revealed a marked reduction of Oct-4 protein in feeder-free RHAMM+/- mouse ES cultures (BB0166 and XP0038). Actin served as a loading control. (E) Western blot analysis revealed a reduction of Numb protein in RHAMM+/- mouse ES cells relative to RHAMM+/+ mouse ES cells, with actin serving as a loading control. Cell lysates, and loading controls, are the same as those used in Figure 1B. (F) Alkaline phosphatase staining was markedly decreased in RHAMM+/- mouse ES cell colonies. Scale bar: 200 µm.

