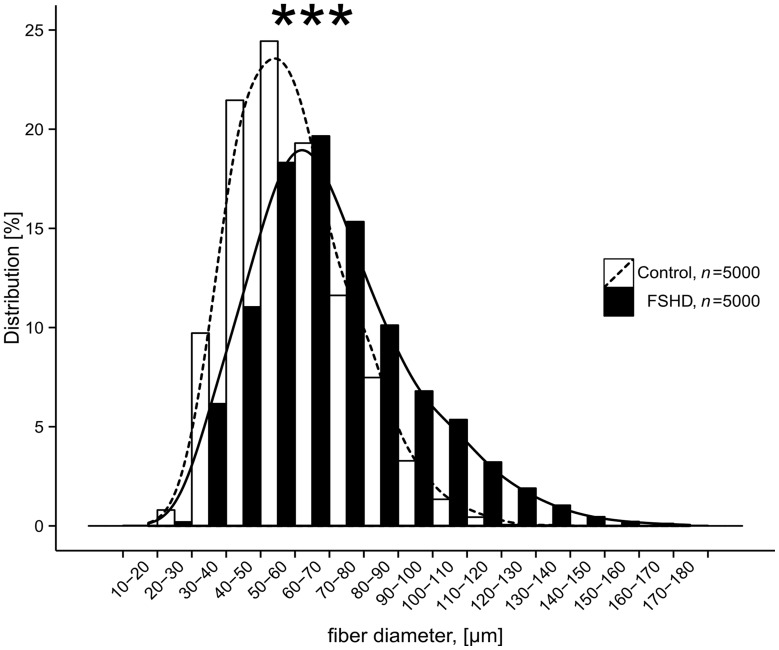
Figure 7. Distribution patterns of myofiber diameters derived from FSHD patients (n = 5) and age-matched healthy controls (n = 5).
Diameters (µm) from 1000 myofibers each were measured in H&E-stained cross sections under a light microscope by using the Image J software. Cumulative data are presented (FSHD: mean 71 µm, SD 23 µm; Control: mean 59 µm, SD 17 µm), p<0.001, Wilcoxon test.

