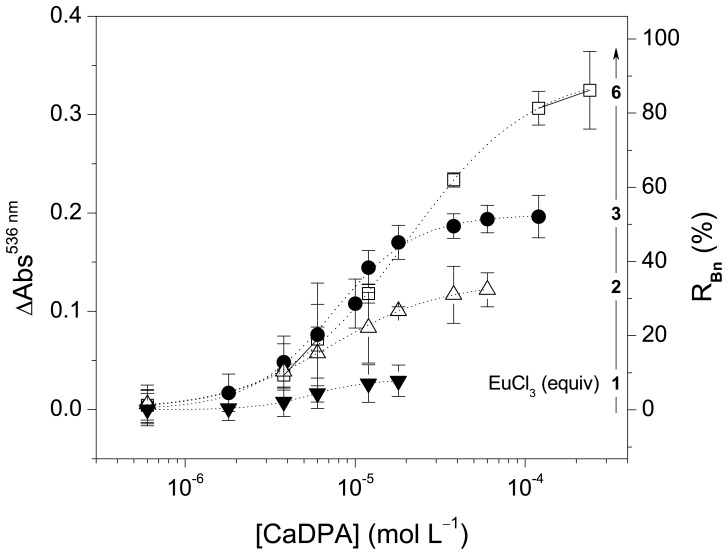
Figure 3. Effect of the concentration of EuIII on the quantification of CaDPA.
The variation of the absorbance at 536 nm and the percent recovery of Bn are plotted against the concentration of CaDPA (log scale). Lines indicate the fitting of data using Eq. (3) with parameter Amin set to zero; [Bn] = 5.8 µmol L–1 in MOPS buffer. LOD are: 6 equiv, (2.8±1.5)×10–6 mol L–1; 3 equiv, (2.2±1.1)×10–6 mol L–1; 2 equiv, (1.4±0.9)×10–6 mol L–1 and 1 equiv, (1.7±0.8)×10–6 mol L–1.

