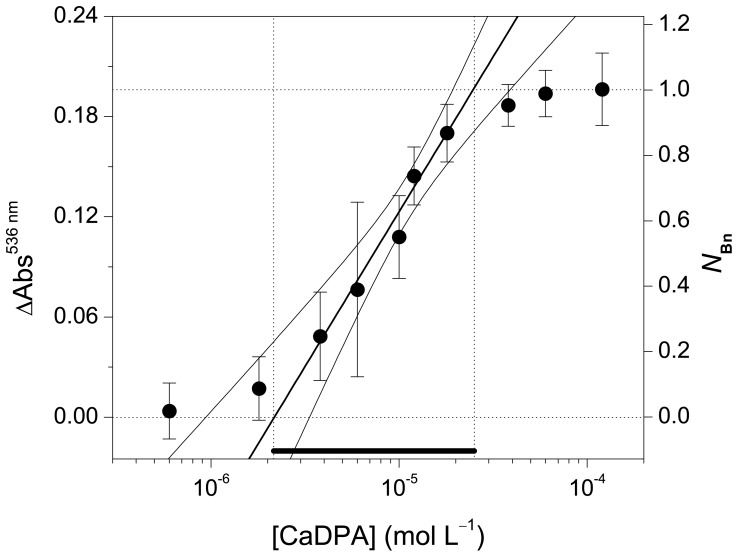
Figure 4. CaDPA concentration (log scale) plotted against the variation in the absorbance at 536 nm (ΔAbs536 nm) and the normalized response (N Bn).
The diagonal straight-line shows when the plotted parameters are linearly correlated. Curved lines are the confidence bands at the 95% level. Error bars represent the sd of triplicates. [Bn] = 5.8 µmol L–1, [EuCl3] = 17.4 µmol L–1 (3 equiv).

