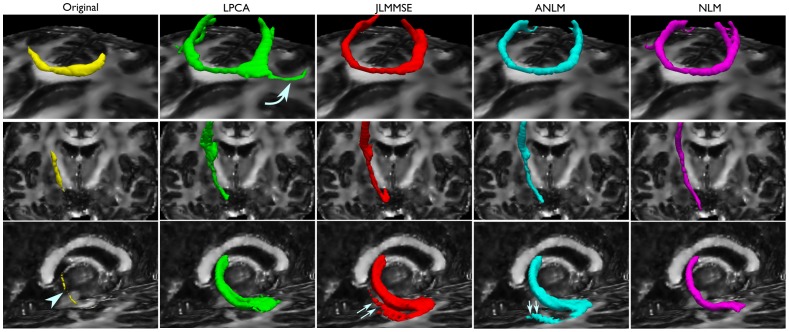
Figure 9. Tractography of the genu of the corpus callosum (first row), the posterior limb of the internal capsule (second row) and right crus of fornix (third row), overlaid on the FA map derived from the LPCA-denoised data.
Isosurfaces represent those voxels that are intersected by at least 100 tracts in the case of the corpus callosum and internal capsule, and by at least 7 in the case of the fornix. Notice the limited propagation of all the tracts derived from the original, low SNR, data sets (first column), with the crus of the fornix barely visible (arrowhead). The corpus callosum was extended by all algorithms, but reached even farther in the LPCA-denoised data set (curved arrow). The crus of the fornix is extended and its width increased by all denoising methods, but JLMMSE and ANLM-denoised data sets produced spurious tracks (double arrows), which were not produced in the LPCA and NLM-denoised data sets.

