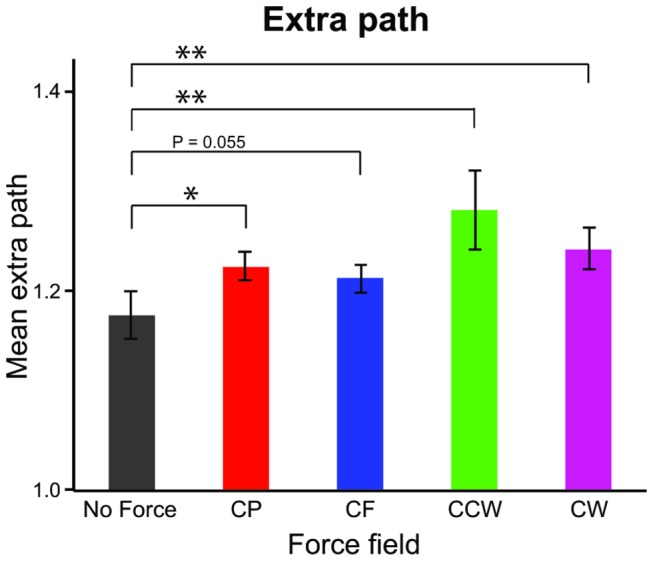
Figure 6. Mean extra path for the five different force fields.

Color-coding as in Figure 1B. Each bar shows the mean of the extra path for all subjects in Experiment 1. Error bars show SE’s. The extra path is shorter without forces than with forces. The asterisks denote that the difference is significant (* = p < 0.05, ** = p < 0.01).
