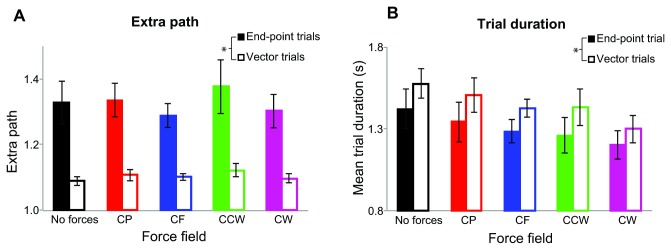
Figure 9. Results of Experiment 2.

A) Extra path for the five different force fields and two different trial types. Filled bars show the results of the end-point trials and open bars of the vector trials. In the vector trials the extra path is significantly shorter than in the end-point trials (p<0.01). B) Mean trial duration for the different force fields and trial types. In the vector trials the mean trial duration is significantly longer than in the end-point trials (p<0.05). Error bars show standard errors.
