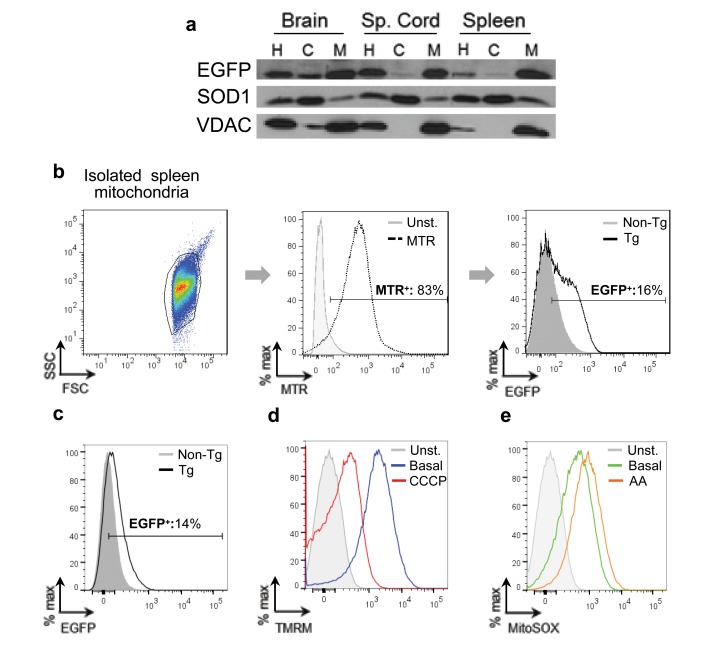
Figure 4. EGFP is expressed within mitochondria.
(A) Homogenates (H), cytosolic protein (C) and purified mitochondria (M) were collected from the brain, spinal cord and spleen of transgenic mice and probed for EGFP via immunoblot. SOD1 and VDAC serve as controls for cytosol and mitochondria, respectively. (B) Mitochondria were isolated from the spleens of transgenic and non-transgenic mice. Left: Mitochondria were gated according to their light scattering properties (forward scatter, FSC; side scatter, SSC). Middle: Gated mitochondria were stained with MitoTracker Red (MTR, black, dashed) and compared to unstained (grey, shaded) mitochondria. Right: MTR+ mitochondria from transgenic (black, unshaded) and non-transgenic (grey, shaded) mice were analyzed for EGFP expression. Data presented is representative of three independent experiments. (C) Mitochondria from transgenic (black, unshaded), and non-transgenic (grey, shaded) mice were analyzed for EGFP expression. (D) The transmembrane potential of EGFP+ mitochondria was assayed using TMRM. Mitochondria were left, unstained (grey, filled), treated with TMRM, basal conditions (blue), or treated with the protonophore CCCP (red). (E) Mitochondrial superoxide production of EGFP+ mitochondria, was assayed using MitoSOX Red. Mitochondria were left, unstained (grey, filled), treated with MitoSOX Red under basal conditions (green), or treated with the complex III inhibitor Antimycin A (orange). C, D, E are from the same sample and are representative of three independent experiments.

