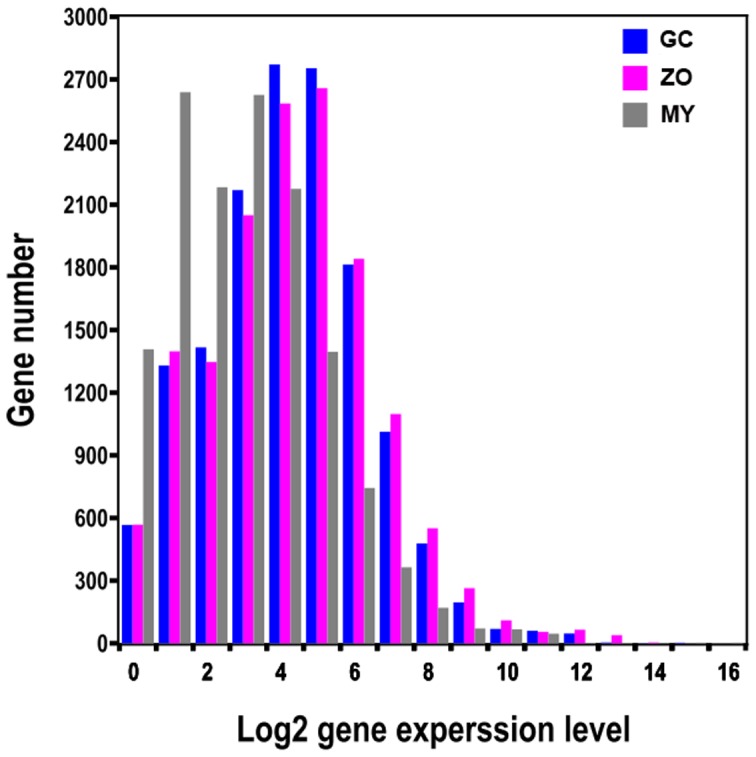
Figure 2. The distribution of gene expression levels.

Total reads from each of three libraries that match to the 19,805 P. capsici gene models were plotted as integrated log2 values. The distribution is based on the number of genes falling in each log2 gene expression category.
