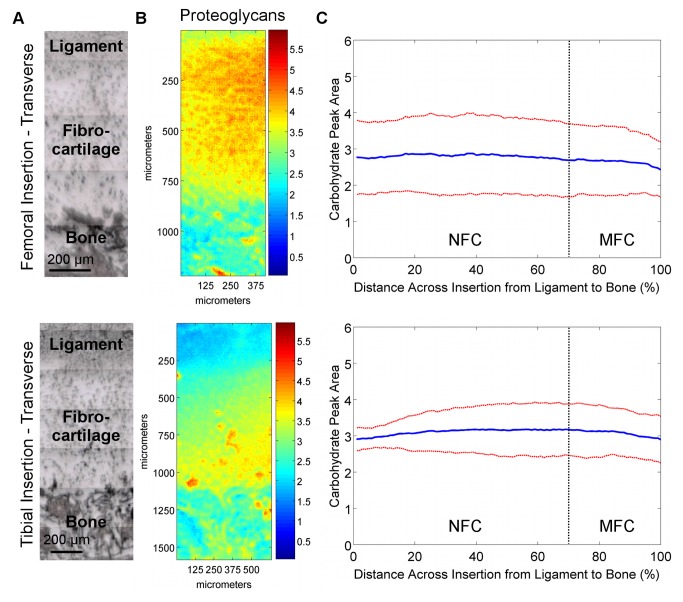
Figure 4. Proteoglycan distribution in transverse sections of femoral and tibial ACL insertions.
A) Light microscopy images showing ligament, fibrocartilage, and bone regions (bar = 200 μm). B) Spectroscopic maps of proteoglycan distribution. Blue and red colors indicate low and high matrix content, respectively. Proteoglycan distribution was found to be highly variable, with regions of high and low PG content seen in both insertions. C) The high lateral variability in proteoglycan distribution is revealed by the large deviation (red) from the mean (blue) peak area values, and is more evident in the femoral insertion compared to the tibial insertion (n=3; NFC = Non-mineralized Fibrocartilage, MFC = Mineralized Fibrocartilage).

