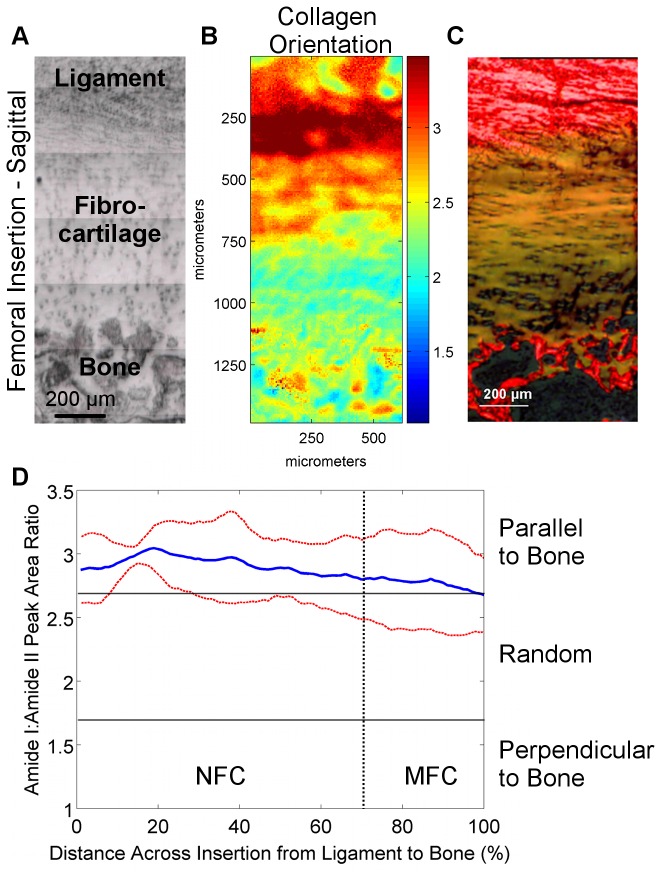
Figure 6. Collagen orientation in femoral insertions (sagittal samples).
A) Light microscopy images showing the scan area (bar = 200 μm). B) Corresponding spectroscopic maps showing collagen orientation as determined by the amide I: amide II peak area ratio at 0° polarizer orientation. Values greater than 2.7 (red) and less than 1.7 (blue) indicate alignment parallel and perpendicular to the fibrocartilage-bone interface, respectively, whereas intermediate ratios (light blue to orange) indicate random orientation. C) Collagen orientation as visualized by polarized light microscopy of Picrosirius red histological stains. D) Average collagen orientation (0°) within the insertion fibrocartilage progressing from ligament to bone. Collagen fibers in the fibrocartilage region are initially parallel to the fibrocartilage-bone interface but obtain a more random orientation toward mineralized fibrocartilage and bone (Blue and red lines represent mean values and standard deviation, respectively; n=3; NFC = Non-Mineralized Fibrocartilage, MFC = Mineralized Fibrocartilage).

