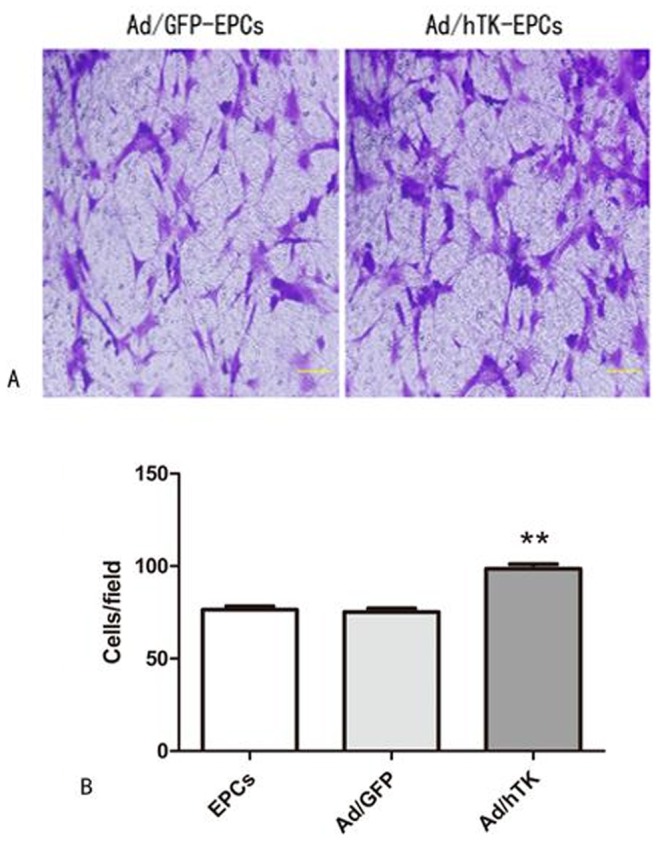
Figure 5. EPCs migration assays.

A: Representative macroscopic photographs of Ad/hTK-transduced EPCs, Ad/GFP-transduced EPCs after 24 hours in response to growth factors respectively. Left panel shows Ad/hTK-transduced EPCs; right panel, Ad/GFP-transduced EPCs (×100 magnification); B: Quantitative analysis of EPC migration (**P<0.01 versus Ad/GFP transduced-EPCs or EPCs = .
