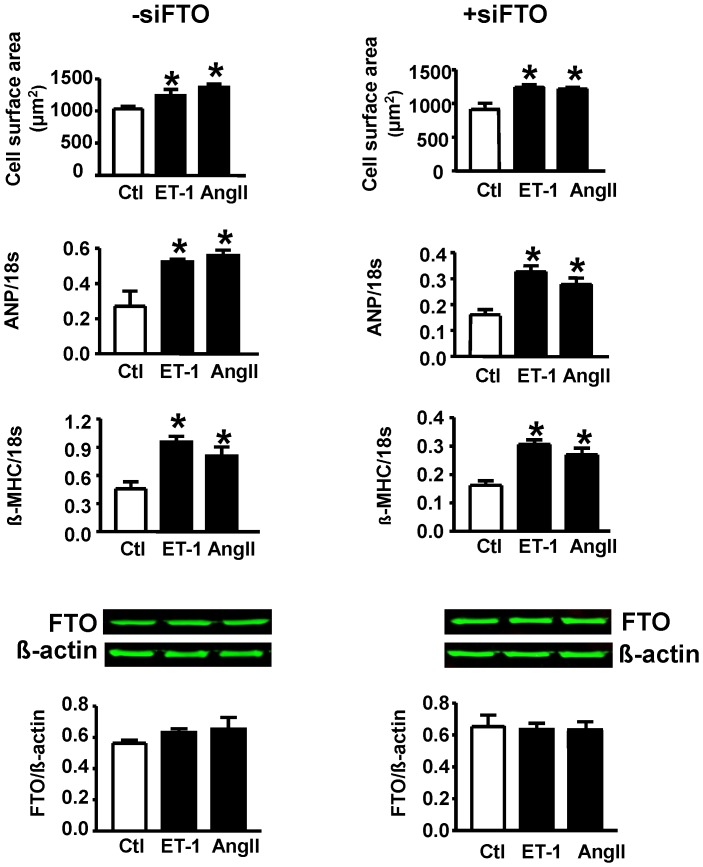
Figure 3. Hypertrophic responses to either endothelin-1 (ET-1) or angiotensin II (Ang II) in the absence (−siFTO) or presence (+siFTO) of FTO downregulation.
Hypertrophy was assessed by determining cell surface area as well as expression of ANP or β-MHC. Bottom two panels show Western blot data with representative blots for different treatments. N = 5. Ctl, control. No differences were observed between any treatment group.

