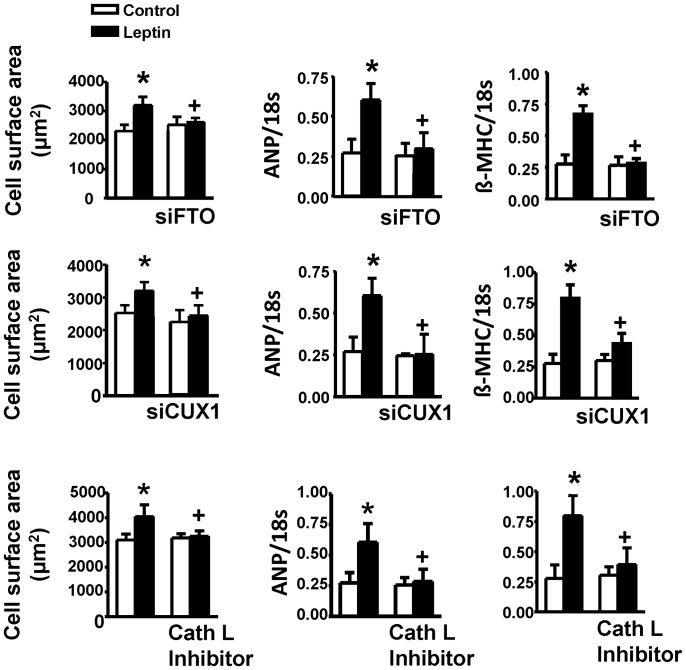
Figure 8. Hypertrophic responses to leptin with FTO, CUX1 and cathepsin L (Cath L) inhibition.
Cell surface area is shown in the left row whereas expression of ANP and β-MHC are depicted in the middle and right rows, respectively. Note that the hypertrophic responses to leptin were abolished by all treatments. Data are presented as mean+SEM. N = 7. *P<0.05 from respective control values. +P<0.05 from the leptin alone group.

