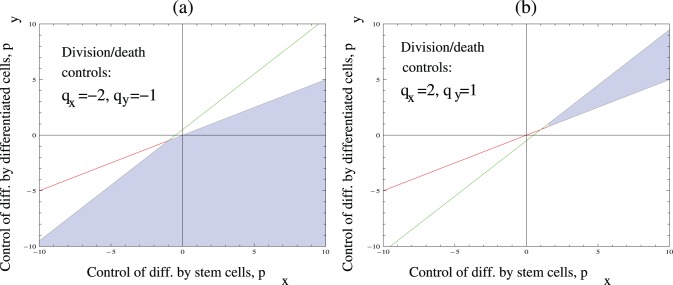
Figure 3. A graphical representation of stability conditions(4–5).
For fixed values of controls  and
and  , we identify the region of the
  space corresponding to stability of the stem cell system. The borders of this region are given by lines
  and
and  . (a) Negative division controls:
  ,
,  . (b) Positive division controls:
  ,
,  . The parameter
  .
.

