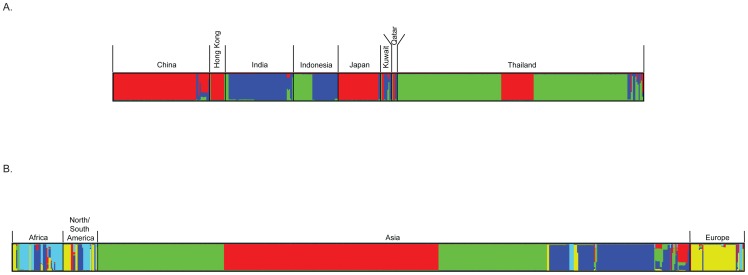
Figure 5. Population structure analysis among Asian C. neoformans var. grubii isolates obtained with the program STRUCTURE.
(A) Comparing isolates from different countries and (B) global C. neoformans var. grubii isolates (data from http://mlst.mycologylab.org). The population groups are indicated by different colors. Each bar represents the individual isolates. Mixed color bar represents to share haplotypes in the individual isolate.

