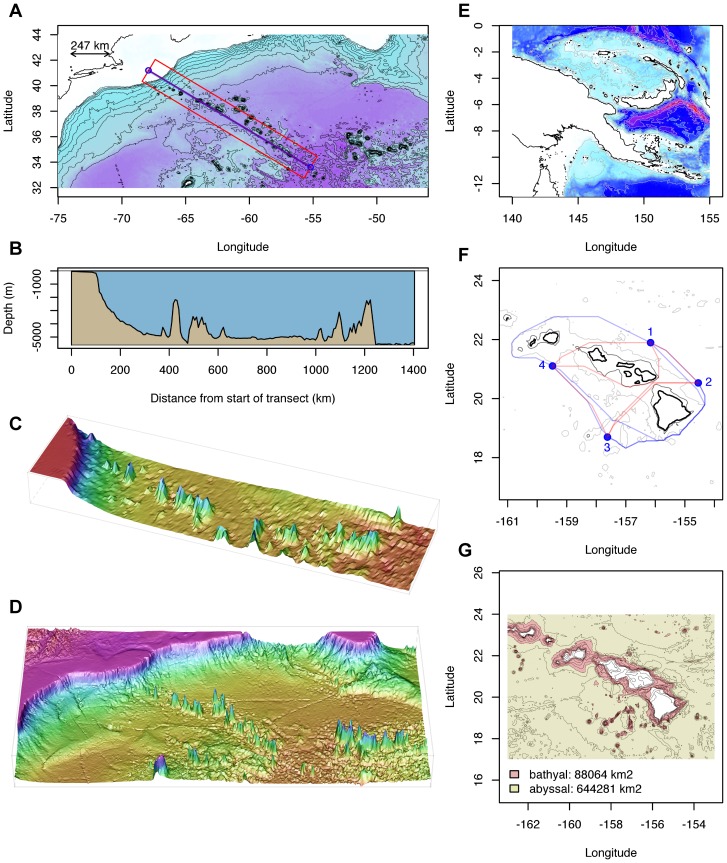
Figure 1. Examples of two and three dimensional plots created using marmap tools.
Left panel (A): data from the NW Atlantic Ocean, showing the NE coast of the USA and the New England and Corner Rise seamounts chains. The blue line represents the position of two- (B) and three- (C) dimensional cross sections, the red rectangle delimiting the area covered by the belt transect. The bottom left figure (D) represents the NW Atlantic data as plotted with the wireframe function from package lattice [21], based on data imported with marmap. Right panel: map of Papua New Guinea and satellite islands (E; see text). The middle figure (F) represents the results of a least-cost path analysis around the Hawaiian islands (coastline in thick black, dark grey: 1000 m isobath, light grey 4000 m isobath; red line: path avoiding waters shallower than 1000 m, blue line: path avoiding waters shallower than 4000 m). The bottom figure (G) represents the results of projected surface area calculations for the bathyal and abyssal areas around the Hawaiian islands. R code is available in File S1.

