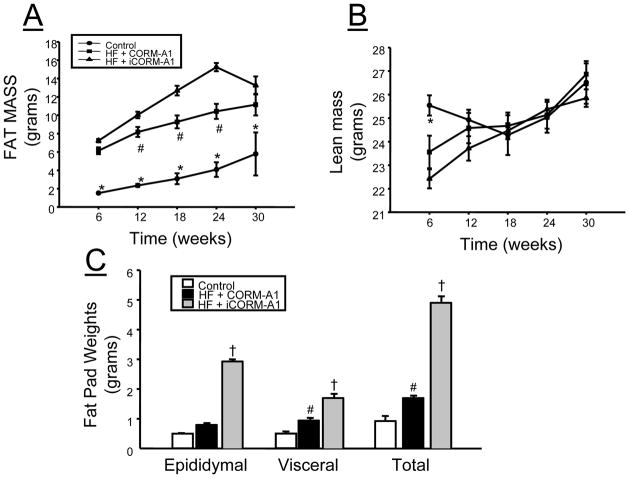
Figure 2.
Effect of CORM-A1 treatment on: A) fat mass as measured by echo-MRI, B) lean mass as measured by echo-MRI, C) fat pad weights measured at the end of the 30 week experimental protocol in control (n=4), high fat (HF) + CORM-A1 (n=9), and high fat (HF) + inactive CORM-A1 (iCORM-A1, n=9) treated mice. *= significant from HF treated mice, P<0.05. #= significant from iCORM-A1 treated mice, P<0.05.

