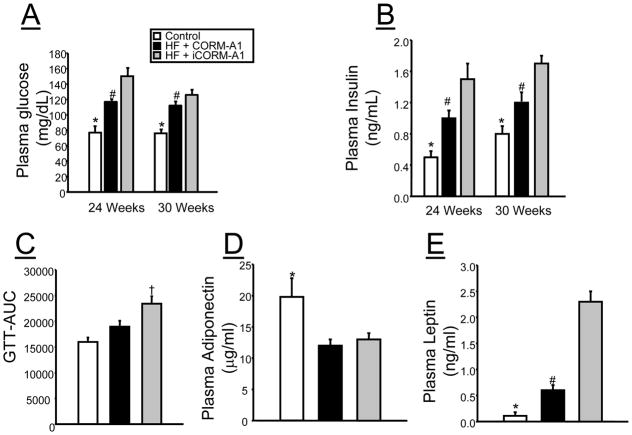
Figure 3.
A) fasted blood glucose measurements in control (n=4), high fat (HF) + CORM-A1 (n=9), and high fat (HF) + inactive CORM-A1 (iCORM-A1, n=9) treated mice. B) Plasma insulin measurements control (n=4), high fat (HF) + CORM-A1 (n=9), and high fat (HF) + inactive CORM-A1 (iCORM-A1, n=9) treated mice. C) Glucose tolerance test area under the curve (GTT-AUC) in control (n=4), high fat (HF) + CORM-A1 (n=6), and high fat (HF) + inactive CORM-A1 (iCORM-A1, n=6) treated mice. Glucose tolerance tests were performed in fasted mice at week 27 of the experimental protocol. D) Plasma adiponectin E) Plasma leptin measurements at week 30 of the experimental protocol control (n=4), high fat (HF) + CORM-A1 (n=9), and high fat (HF) + inactive CORM-A1 (iCORM-A1, n=9) treated mice. *= significant from HF treated mice, P<0.05. #= significant from iCORM-A1 treated mice, P<0.05. † = significant from control and CORM-A1 treated mice, P<0.05.

